History of Network Diagram
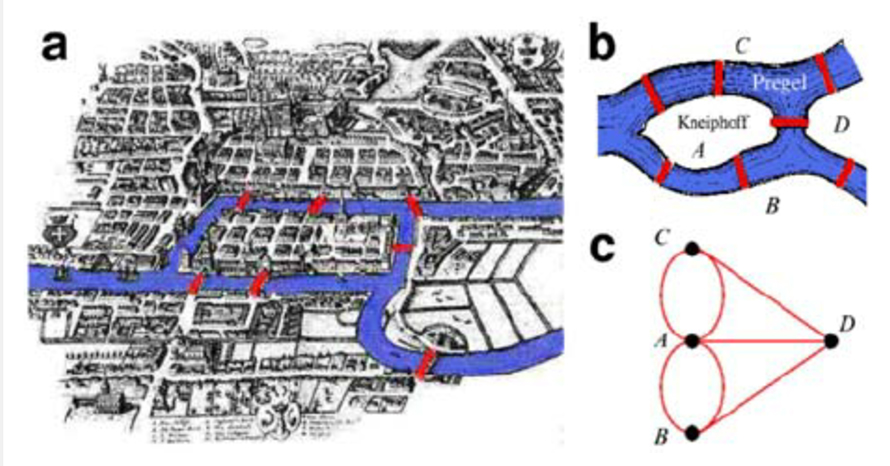
Node-link diagrams trace to 13th-century Ramon Llull’s metaphysical concept combinations. Swiss mathematician Leonhard Euler formalized graph theory in the 18th century, solving the legendary Königsberg bridge problem, proving no single walk could cross all bridges exactly once. Internet growth elevated network analysis across disciplines.
When to Use a Network Diagram?
Visualize activity interdependencies
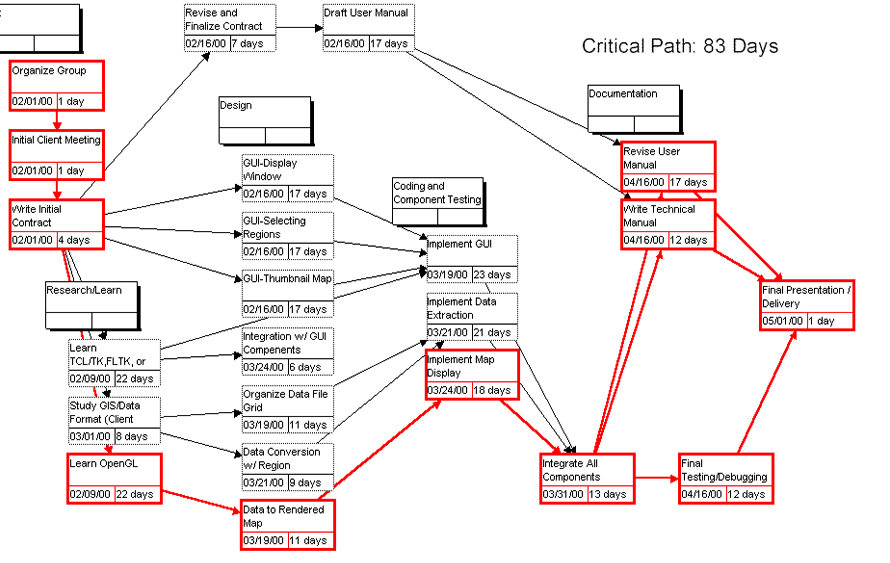
Map project workflows, predecessors, and successors in sequence. Network diagrams snapshot dependencies during planning and execution, revealing critical paths and bottlenecks.
Example: Project workflow network visualization.
Decipher network structure and troubleshoot
Spot clustering, density patterns, and layout anomalies. Vivid node displays surface hidden discrepancies for rapid problem identification and resolution.
Compare node relationships across parameters
Size nodes, weight links, or color-code by additional variables. Multi-dimensional encoding reveals nuanced relationship strengths and patterns.
Types of Network Diagrams
1. Undirected Unweighted Network Diagrams
Show connections only—no direction, no strength weighting.
2. Undirected Weighted Network Diagrams
Connections plus link weights (e.g., interaction frequency).
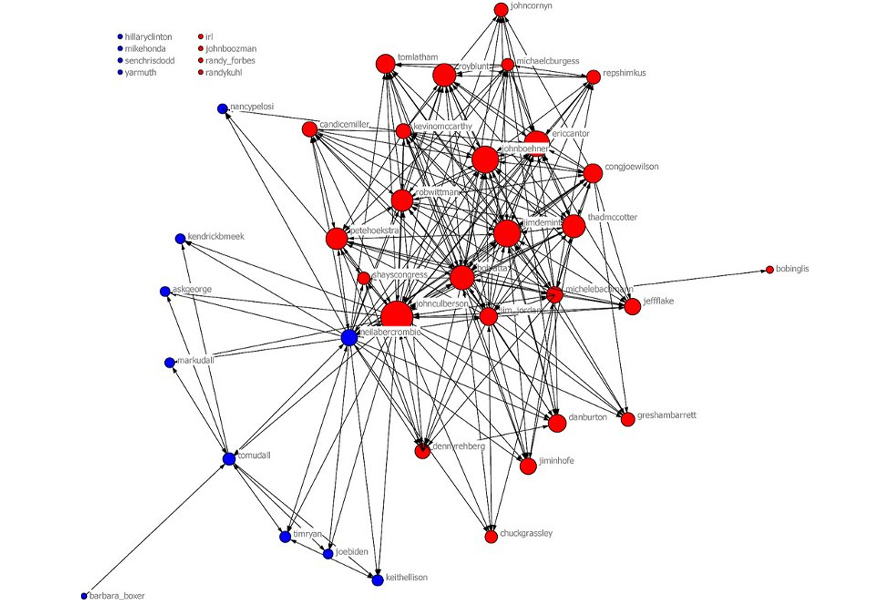
3. Directed Unweighted Network Diagrams
Connections with directional arrows—no strength weighting.
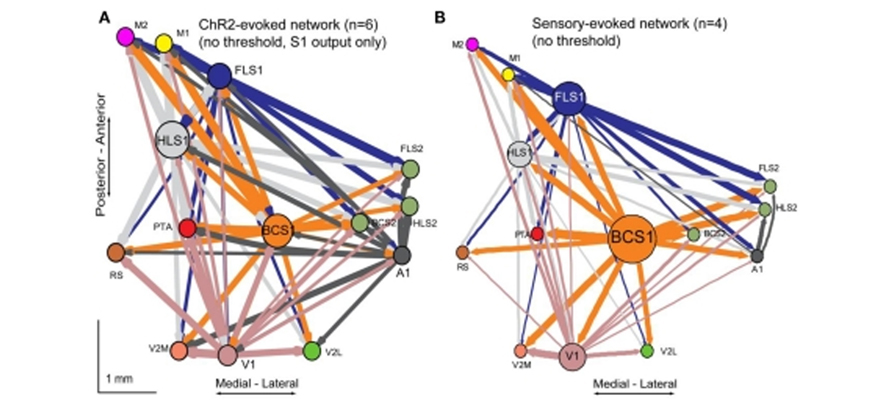
4. Directed Weighted Network Diagrams
Full encoding: direction + weight (e.g., migration flows by population count).
When Not to Use Network Diagrams?
Large node counts create hairballs
Excessive connections overwhelm comprehension. Patterns vanish in visual clutter; interactive diagrams become essential or consider aggregation/simplification.
Need schedule and resource management
Network diagrams excel at relationship mapping, not timeline tracking or resource allocation. Gantt charts better handle project progress, timing, and capacity.