History of Tag Cloud
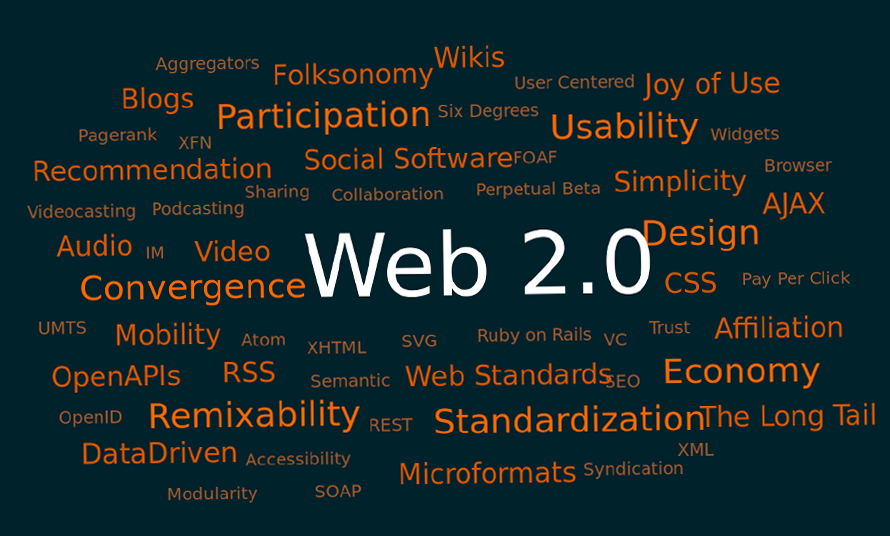
The earliest printed example of a weighted list of English keywords was the “subconscious files” in Douglas Coupland’s Microserfs in 1995. This popularized tags becoming commonly used on geographic maps to represent the relative size of cities in terms of relative typeface size. The “tag cloud” rose to prominence in the first decade of the 21st century as a widespread feature of early Web 2.0 websites and blogs, used primarily to visualize the frequency distribution of keyword metadata that describe website content, and as a navigation aid. In 2004, the photo-sharing site Flickr created its first tag clouds, popularizing it further leading to oversaturation of the method. Various extensions of tag clouds have now been created to combine them with a number of interactive features of text analysis.
When to Use a Tag Cloud?
Analyze your user/employee sentiment
Use Tag Clouds when you have a lot of qualitative data, to identify key patterns from. Feedback from users/employees in the form of unstructured data can be converted into actionable insights. It is difficult to consume and find the insights in a tabular format, however, they can pop out quickly in a tag cloud.
Aid in Search Engine Optimization and use as website navigation aids
Use Tag Clouds as navigation aids by hyperlinking the terms associated with the tag. In recent years tag clouds have gained popularity because of their role in search engine optimization of Web pages as well as supporting the user in navigating the content in an information system efficiently. Use Tag clouds as a navigational tool to make the resources of a website more connected, when crawled by a search engine spider, which may improve the site’s search engine rank. From a user interface perspective, they are often used to summarize search results to support the user in finding content in a particular information system more quickly.
Search for Patterns in Data
Use Tag Clouds if you need to search for patterns in qualitative data and enrich the user insights. The benefits of the tag cloud are that large records can be categorized intuitively by popularity or frequency using catchwords. Poring over text to develop themes from research takes time and tag clouds come to rescue with quick sharing back results from research in a way that doesn’t require an understanding of the technicalities.
Types of Tag cloud
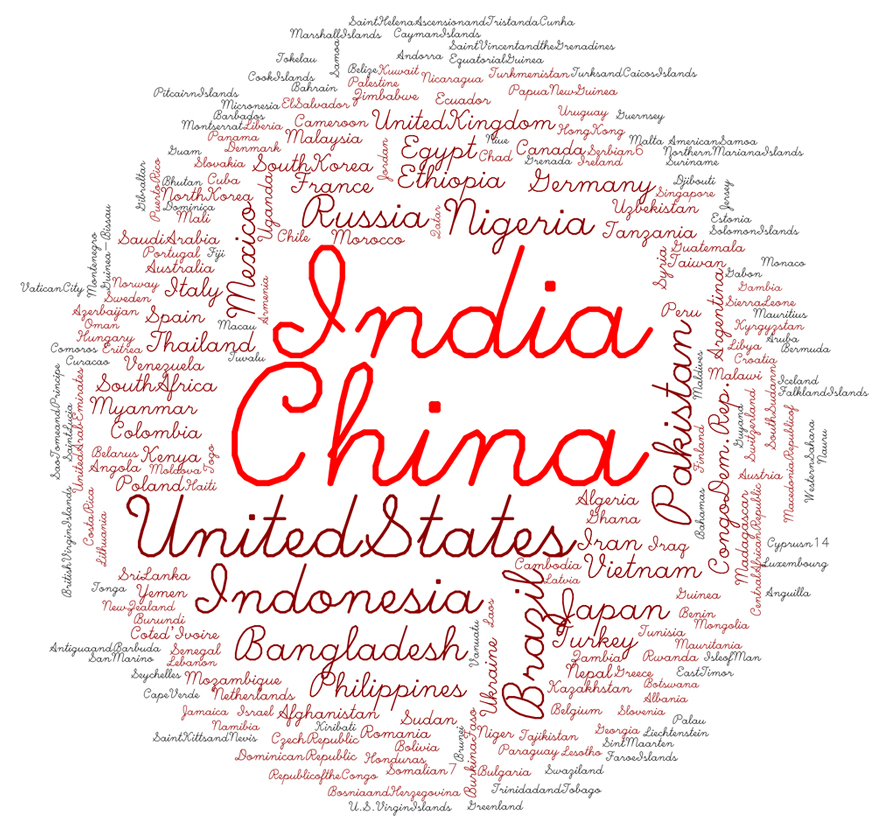
1. Data clouds
This is a data display that uses font size and/or color to indicate numerical values, similar to a tag cloud however instead of word count, these display data such as population or stock market prices.
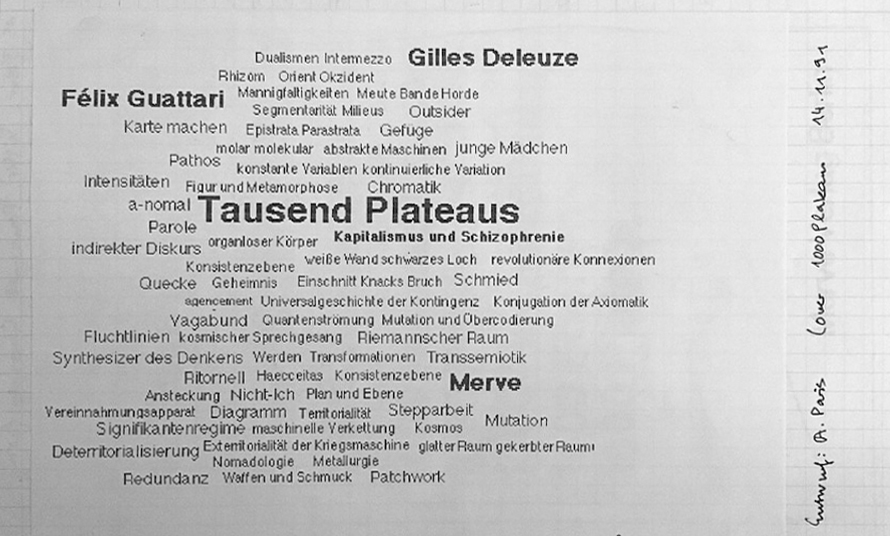
2. Text clouds or Word clouds
A visualization of word frequency in a given text as a weighted list. This technique has recently gained popularity to visualize the topical content of political speeches
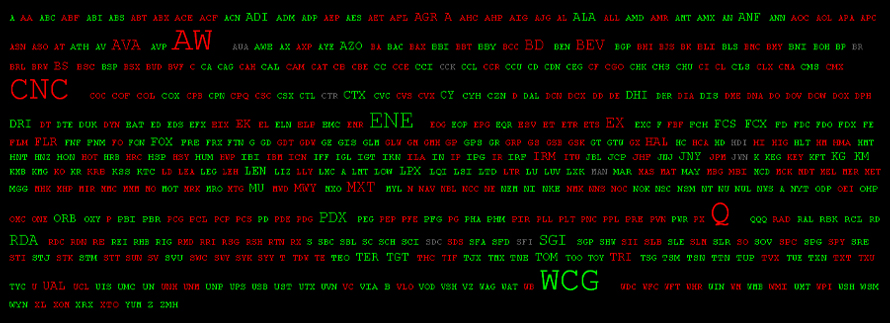
3. Collocate clouds
This provides a more focused view of a document or corpus by examining the usage of a particular word instead of summarising an entire document. The resulting cloud contains the words which are often used in conjunction with the search word. These collocates are formatted to show frequency (as size) as well as collocational strength (as brightness). This provides interactive ways to browse and explore language.
When Not to Use a Tag Cloud?
When your data isn’t optimized for context
Tag Clouds do not serve the purpose of popping out the key and relevant insight when the data is not coherent and complete for the context for which information needs to be visualized. Check other factors also while comparing which can affect the visual ‘decoding’ of the data from the observer’s perspective. For example, the length of the word and the white space around the glyphs (letters) can make it look more or less important relative to others in the cloud.
When Tag clouds cannot be compatible to be built for the web platforms
Do not use graphics as tag clouds. On the web, tag clouds need to be in HTML and must be constructed on the client-side using the fonts available in the browser, and they must fit in a rectangular box. As a browser platform can be volatile, a tag cloud on the web that does not address the problems of modeling and controlling aesthetics while constructing a two-dimensional layout of tags should not be used. Also, color should communicate not confuse.