There are different types of area chart, including stacked and 100% stacked charts, which layer multiple data series to illustrate their contributions to a whole. This makes area charts especially useful in scenarios where the relationship between components and totals is important, such as revenue versus expenses or segment-wise sales over time. Tools like Power BI provide robust support for creating dynamic area charts, enhancing your area visualization capabilities in dashboards and reports.
History of Area Charts
William Playfair, a Scottish engineer and political economist, is credited with creating the first area charts in 1786. In his groundbreaking book, The Commercial and Political Atlas, Playfair introduced innovative graphical methods to represent economic data visually. One notable chart illustrated England’s national debt over time in relation to war.
Among the many charts in the atlas, Playfair included one comparing England’s imports and exports from 1700 to 1782. This area chart not only showed the progression of imports and exports individually with time but also allowed a visual comparison between the two, making it easier to understand their relative changes and trends.
Playfair’s work was pioneering in statistical graphics, using filled areas to communicate cumulative data effectively—a technique that laid the foundation for modern area charts in data visualization. His approach transformed complex numerical data into intuitive visual stories, influencing how economic and trade information could be understood at a glance.
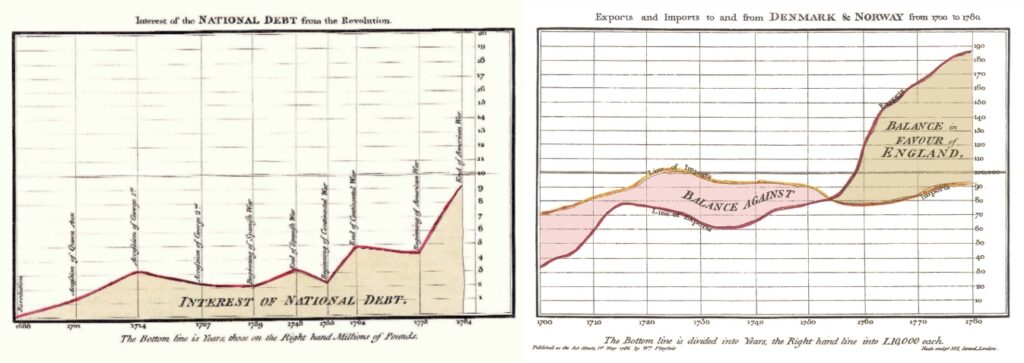
Here, the chart of all the Imports and Exports to and from England from the Year 1700 to 1782, compares the progression of imports and exports with time, while also comparing both these values with each other.
When to Use an Area Chart in Data Visualization
1
Discover Trends of Magnitude Over Time
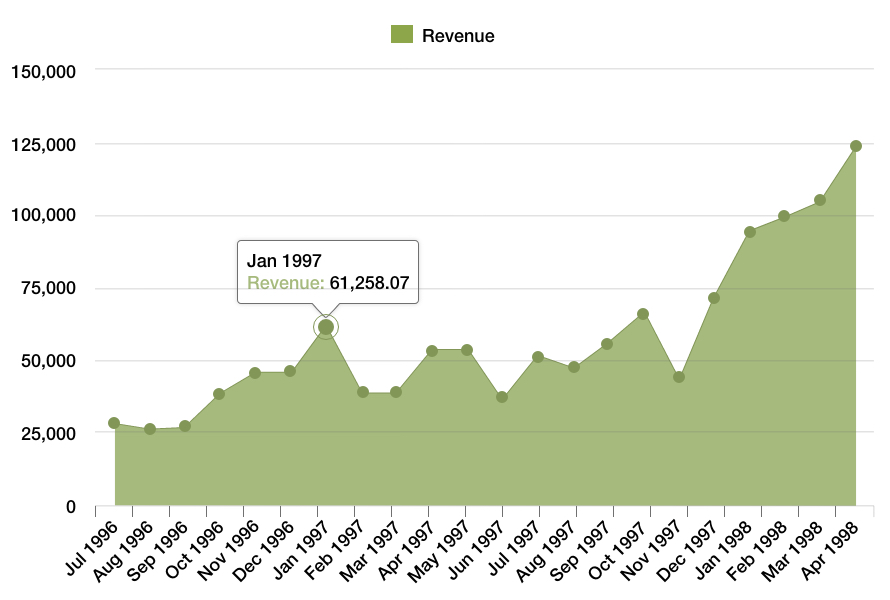
Use an area chart in data visualization to highlight trends where the shaded area conveys the magnitude of values over time. It works best with a limited number of data points by visually representing the summation and its change, giving an immediate sense of the data’s progression.
2
Compare Different Quantities While Analyzing Trends
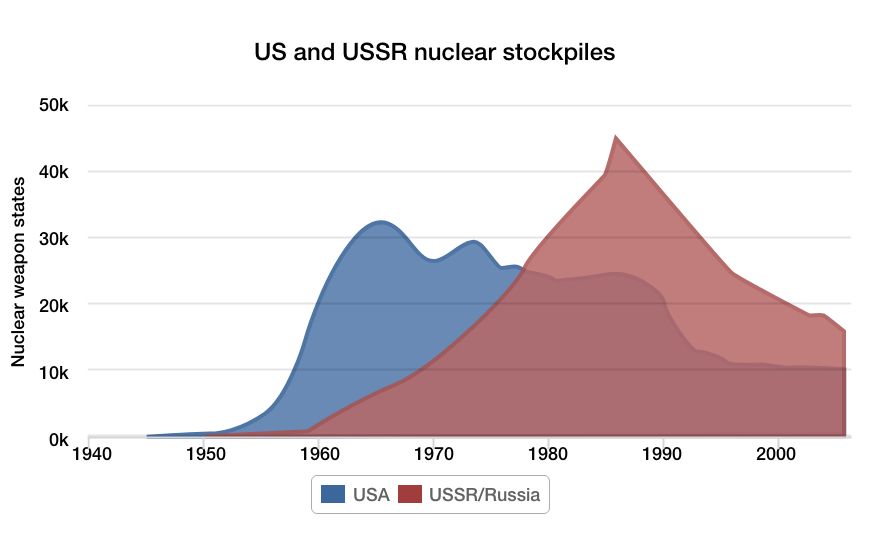
For multiple attributes, plot each as a coloured fill sequentially—such as in stacked area charts—to compare how different categories evolve over time. The overlapping-coloured areas reveal relationships and insights between data series, making it easy to analyse comparative trends.
Spline Area Chart
Source
3
Represent Proportions and Part-to-Whole Relationships
Area charts effectively show cumulative totals or percentages over time, illustrating how individual categories contribute to the whole. This visualizes part-to-whole dynamics without overwhelming the viewer, providing clear insights into category performance and changes.
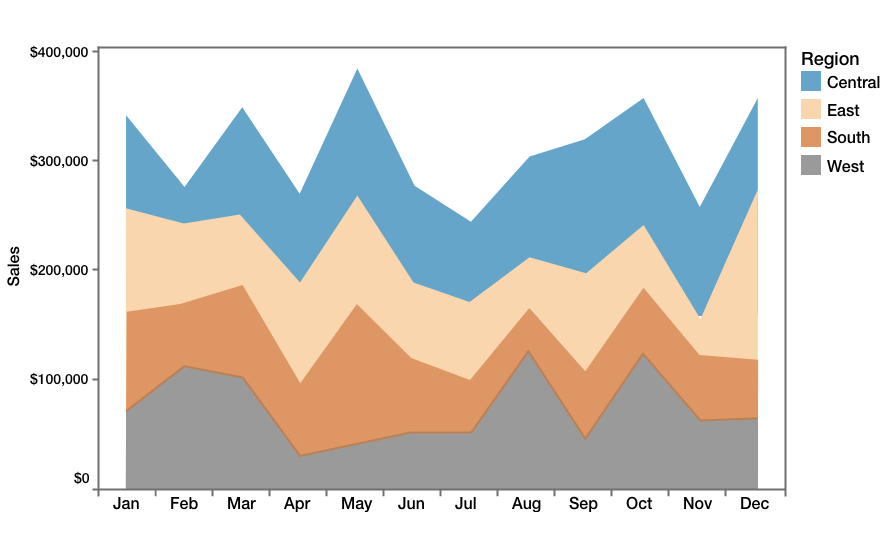
Stacked Area Chart
Source
Types of Area Charts
1. Step Area Charts
Connect data points using vertical and horizontal lines to create a step-like progression.
2. Spline Area Charts
Link data points with smooth curves for a flowing visualization.
3. Stacked Area Charts
Display how different parts contribute to a whole across time, ideal for part-to-whole and multi-series comparison.
When Not to Use an Area Chart in Data Visualization
1
When Exact Values Are Required
Area charts focus on overall trends and cumulative magnitude, making it difficult to read precise values, especially when colours overlap or transparency is used. For detailed exact figures, other chart types like line or bar charts are preferable.
2
When Comparing Many Categories
With numerous categories, area charts can become cluttered and hard to interpret due to overlapping areas. In such cases, using line charts or other clearer visualization techniques is recommended for better clarity.