History of Gantt Chart
The first Gantt chart precursor, known as the harmonogram, was devised in the mid-1890s by Polish engineer Karol Adamiecki. Around 1910, American engineer Henry Gantt created his version, which gained widespread popularity in Western countries. Early Gantt charts were handmade, requiring complete redraws for schedule changes until computers automated adjustments by the 2010s.
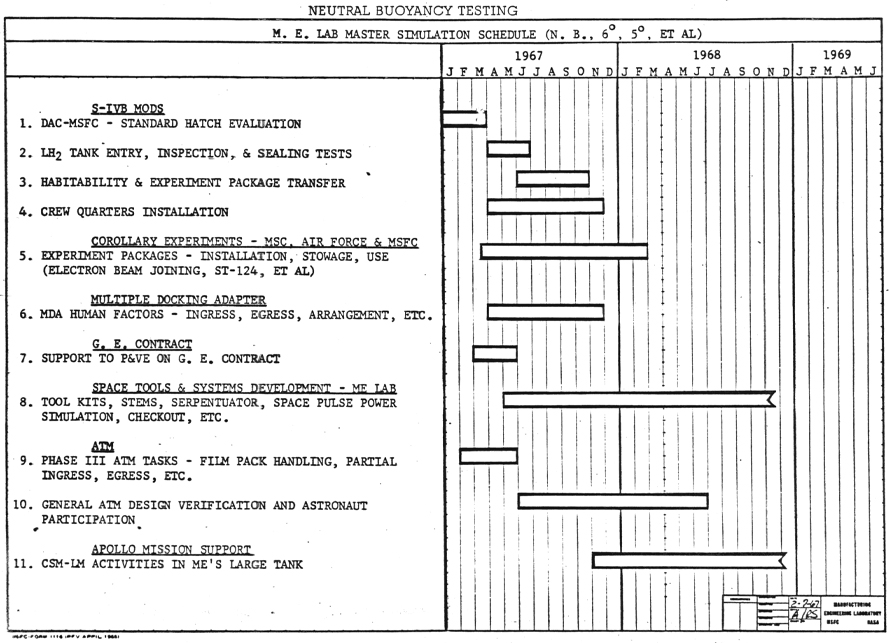
Hand drawn Gantt chart representing a Lab master’s simulation schedule
Source
When to Use a Gantt Chart?
1
For time-based planning and scheduling
Use Gantt charts to create timelines for activities, set milestones, track progress, and allocate resources. They capture task relationships, completion status, and resource usage, ensuring smooth project execution in typical Gantt chart use case scenarios.
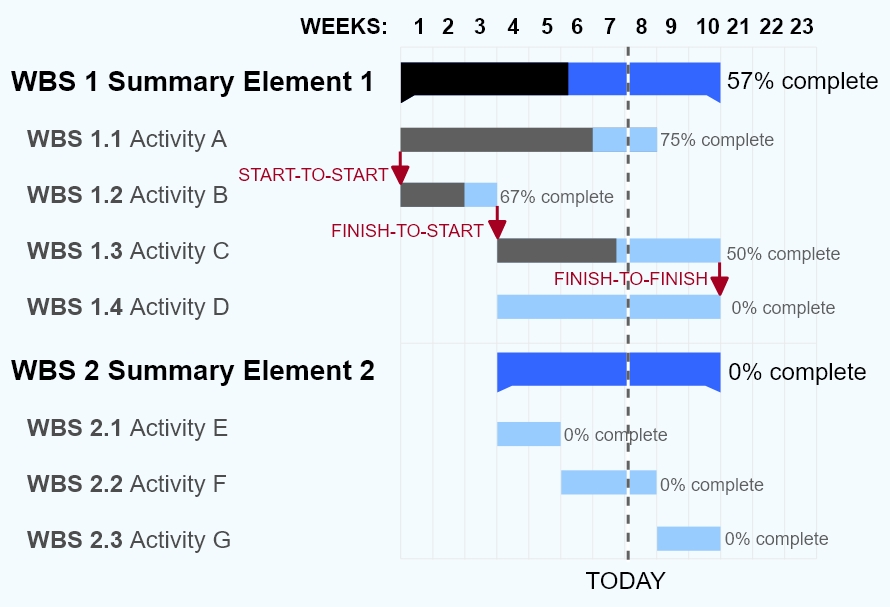
A Gantt chart showing three kinds of schedule dependencies (in red) and percent complete indications.
Source
2
To understand task interdependencies and overlaps
Gantt chart software links dependencies (start-to-start, start-to-finish, finish-to-finish, finish-to-start) with connecting lines and arrows. Critical paths appear in red, slack as black lines, and weekends are excluded from schedules. Often paired with network diagrams for comprehensive views.
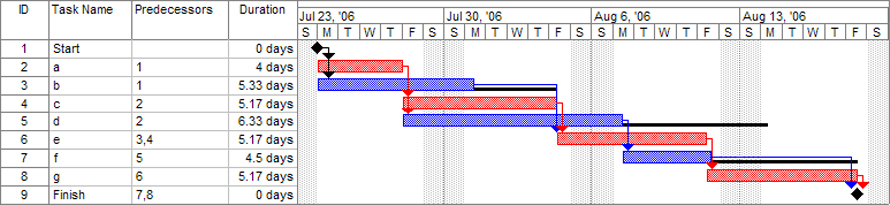
A Gantt chart created using Microsoft Project (MSP). Note (1) the critical path is in red, (2) the slack is the black lines connected to non-critical activities, (3) since Saturday and Sunday are not workdays and are thus excluded from the schedule, some bars on the Gantt chart are longer if they cut through a weekend.
Source
3
To compare planned vs. actual progress
Shade activity bars by completion percentage, fully shaded bars indicate finished tasks. Colour differentiation or vertical progress lines reveal schedule variances between planned and actual work.
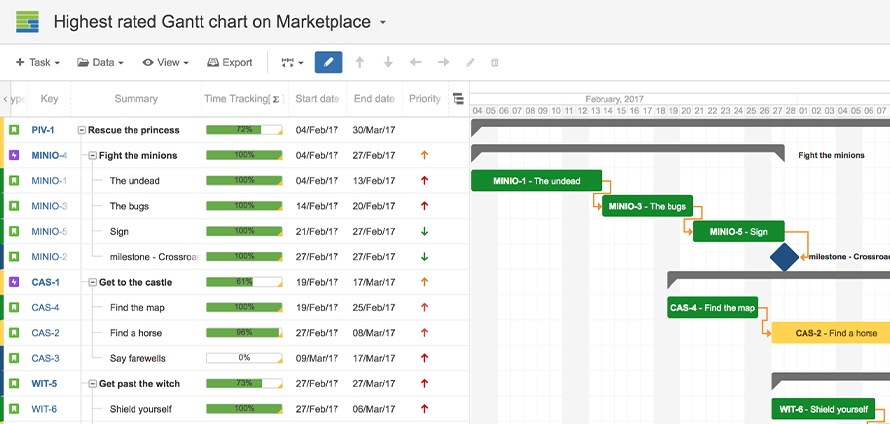
Linked Gantt charts showcasing interdependencies through lines in between
Source
Types of Gantt Chart
Tasks shade proportionally to completion degree. A vertical line at the creation date compares shaded (complete) portions left of the line against unshaded (pending) portions right of the line, visually indicating schedule status.
2. Linked Gantt Charts
Dependency lines connect tasks, though complex projects risk clutter. Critical path network diagrams better communicate intricate relationships in advanced Gantt chart technique applications.
When Not to Use a Gantt Chart?
1
When frequent updates are needed
Paper Gantt charts are tedious to maintain; even digital versions assume complete work breakdown structures. Missing milestones require full rescheduling unless using disposable Gantt chart templates like Tableau presets.
2
For highly complex projects
Gantt chart scheduling loses effectiveness with extensive tasks and subtasks, becoming hard to view on screens and overwhelming in detail.
3
When tracking costs or full scope
Gantt charts focus solely on time, omitting project triple constraints (time, cost, scope). Costs and complete scope complexity cannot be adequately represented.