History of Spider Graph

When to Use a Spider Graph?
Several items need to be compared with more than 5 metrics of features or characteristics
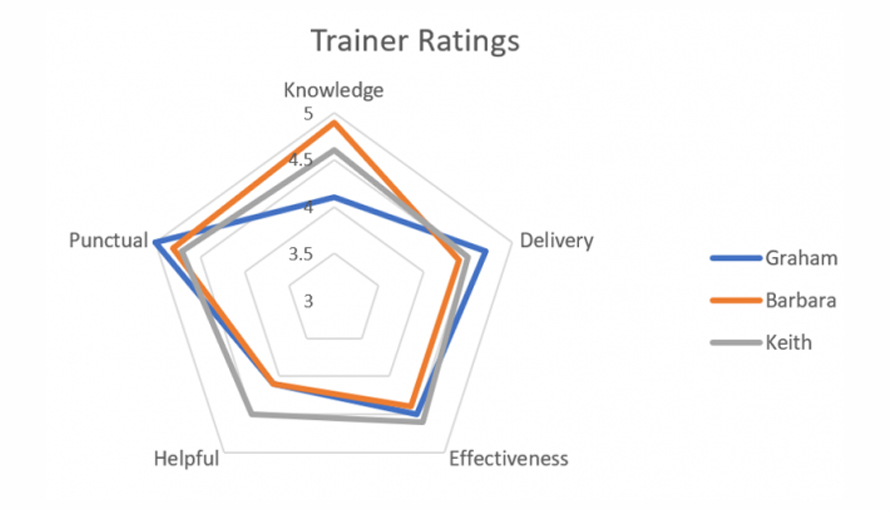
The distinctive feature of the radar chart is that it can enable a general comparison of all metrics to make a decision. One can judge the cover area and observing the sharp points on the metric lines can give one an overall understanding of the pros and cons of each item. This is enabled by the design of the chart where all axes are arranged radially, with equal distances between each other, having gridlines that connect from axis to axis are used as a guide. Each variable value is plotted along its individual axis and all the variables in a data set are connected to form a polygon. The chart is more suitable when the exact values aren’t critical for a reader but the overall chart tells some story.

When required to compare multiple entities across multiple parameters
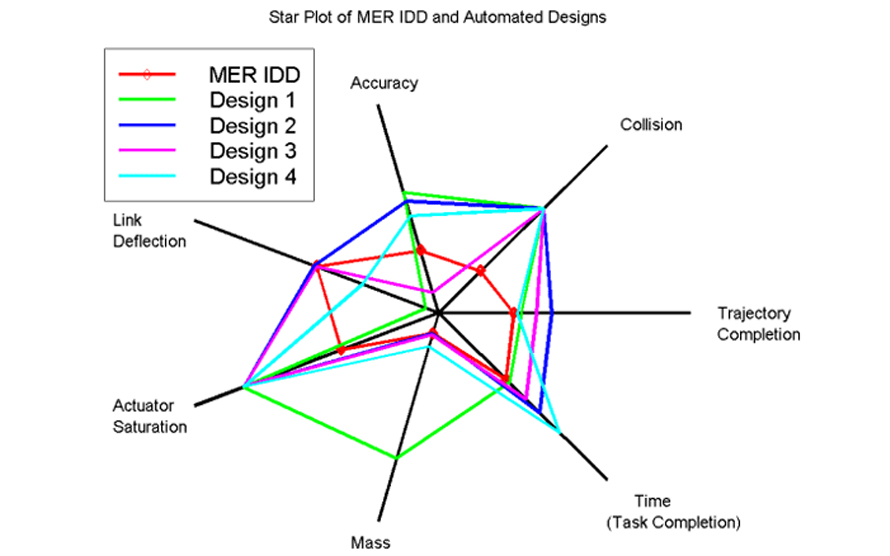
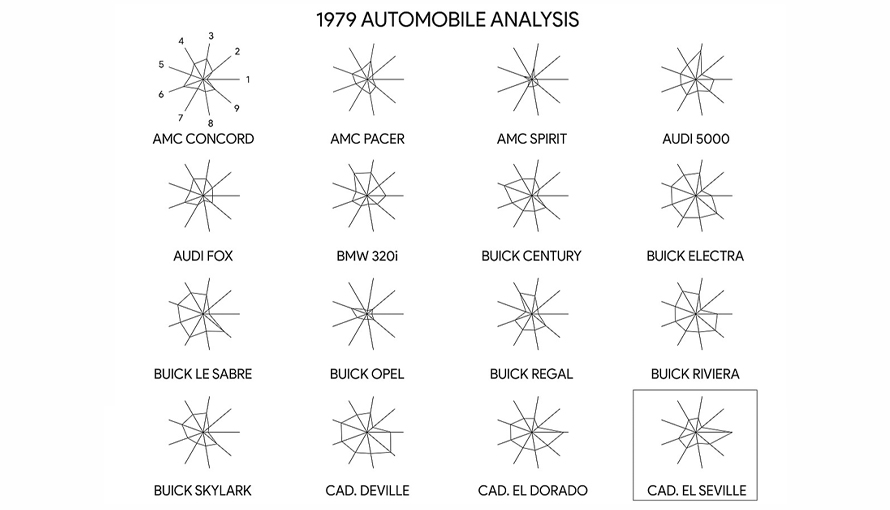
Use radar charts to easily compare each category along its axis and compare overall differences as apparent by the size of each radar. As radar charts are a useful way to display multivariate observations with an arbitrary number of variables, every star that represents a single observation can be compared with the other at a glance.

Identifying striking commonalities and data outliers
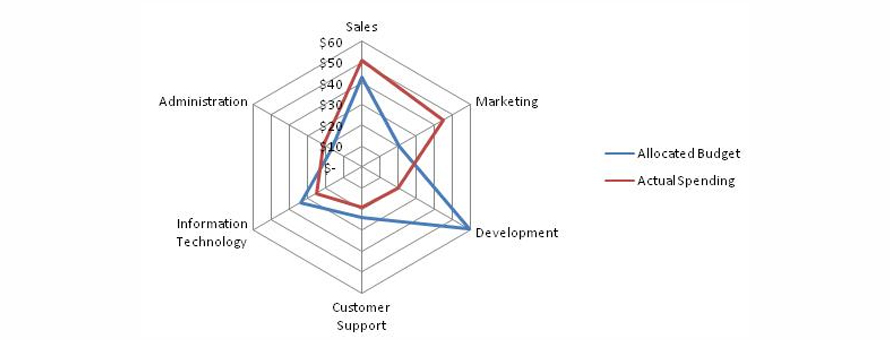
A radar chart is of use for a quick understanding of differences and commonalities and can help in rapid troubleshooting and generating insights. These excel and are most effective when you are comparing target vs achieved performance. In such a scenario, a target can be represented as one star in the chart while the actual performance is represented by others. Looking at the gaps in distance between the target and actual performance represented by stars can help one identify progress and identify anomalies quickly.

Types of Spider Graphs
1. Marked Spider Chart
Very similar to the common radar chart, the only difference it has is the presence of markers to represent each of the data points.
2. Filled Spider Chart
This chart is similar to the radar chart with the sole difference of having the entire area of the radar filled with a color to assist in demarcation with the other radars.
When Not to Use a Spider Graph?
Too many variables clutter the visualization, making it difficult to understand
Having multiple polygons in one Radar Chart makes it hard to read, confusing and too cluttered. Also, if the polygons are filled in, the top polygon covers all the other polygons underneath it. In the case of too many variables, it creates too many axes, the crowd is too much. Though there are multiple axes that have gridlines connecting them for reference, issues arise when you try to compare values across different axes.
When a comparison between the lengths of different spokes is important
Do not use radar charts when the accuracy of comparison is of importance to make a decision. Radar Charts are not so good for comparing multiple data values across each variable, even with the aid of the spiderweb-like grid guide. Comparing values all on a single straight axis is much easier because radial distances are hard to judge visually, hence bar graphs are considered more popular for comparison.