History of Treemap
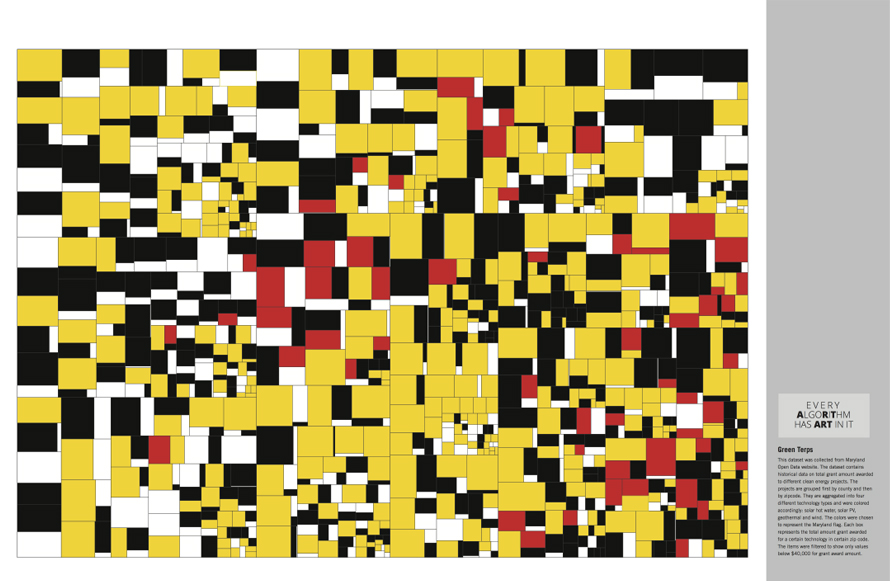
Ben Shneiderman is considered to be the inventor of Treemaps. He created treemaps as a way to visualize a vast file directory on a computer, without taking up too much space on the screen. Treemap has subsequently become an essential method for displaying hierarchical data using nested figures and rectangles in information visualization and computing. A number of different algorithms can be used to determine how the rectangles in a treemap should be sized and ordered.

When to Use a Treemap?
1
When you need to make hierarchical data easy to read and analyze
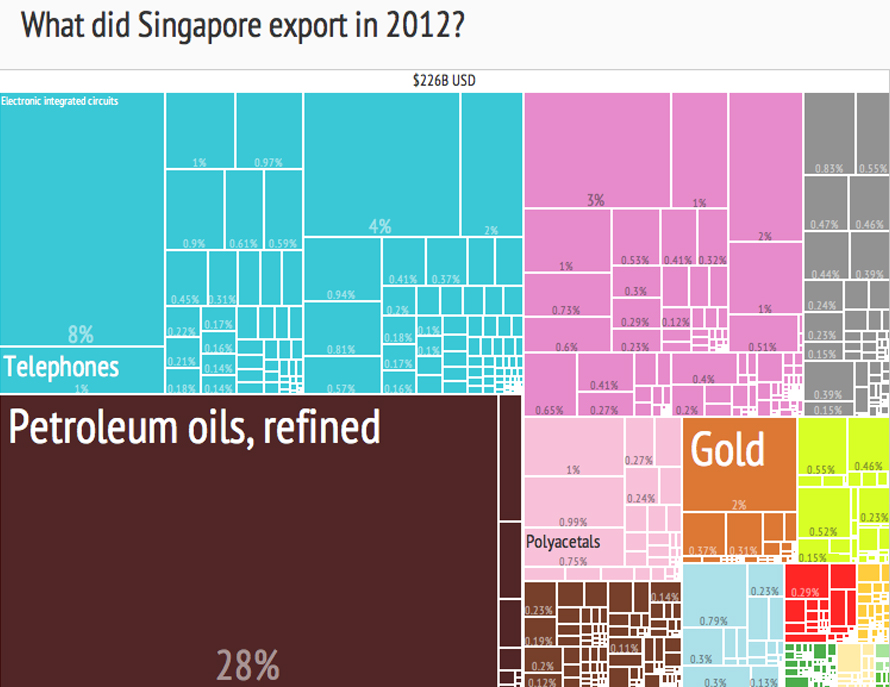
Use treemaps to make hierarchies easier to understand, through rectangles ranging in size from the top left corner of the visualization to the bottom right corner, with the largest rectangle positioned in the top left corner and the smallest rectangle in the bottom right corner. Colour is also used to differentiate allowing one to show both the importance (usually shown by size) and urgency (usually shown by color) of a data point. For nested rectangles size, and thereby also position, of a rectangle that contains other rectangles, is decided by the sum of the areas of the contained rectangles.

2
When you need to compare the proportions in hierarchical data
Use treemaps to compare among hierarchical levels of data, through the color and size dimensions which are correlated with the tree structure, making one easily see patterns that would be difficult to spot in other ways, such as if a certain color is particularly relevant. Treemaps, by their rectangular nature, are better suited for comparison as our minds differentiate size and shape, making rectangles and straight lines easier to compare than slices and angles. Specifically, rectangular treemaps and icicle charts are hence much better for visualizing hierarchies than sunbursts(which are circular in nature).

3
When you require your hierarchical representation to occupy less space
Use treemaps to make efficient use of space. Treemaps are optimized to show lots of data, because it stretches to within its bounding box, as compared to circular charts where space that could be used to tell a story with your data is lost in the corners. As a result, they can legibly display thousands of items on the screen simultaneously.
4
When you need to explore different types of representations which could custom suit your data
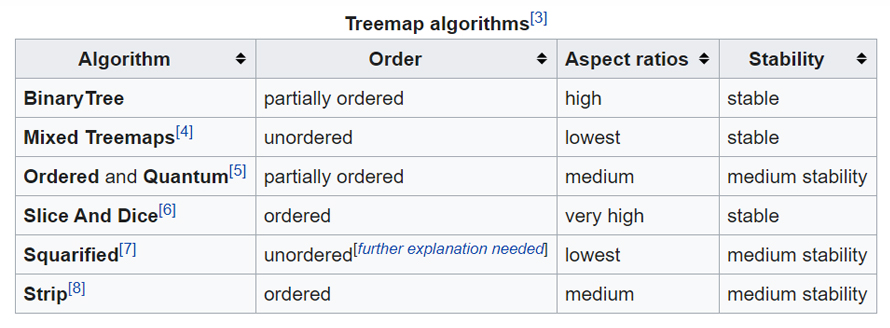
Use and explore with the different algorithms available with treemaps to determine which makes the most optimal use of your data in terms of the aspect ratio. To date, six primary rectangular treemap algorithms have been developed: There is a tiling algorithm that defines the way rectangles are divided and ordered into sub-rectangles. Among the many tiling algorithms having been developed, the “squarified algorithm” is the one that keeps each rectangle as square as possible is the one most commonly used.

Types of Treemaps
1. Convex treemaps
These are made out of algorithms to use space in a way such that the aspect ratio which might be arbitrarily high in the case of rectangular treemaps can be controlled.
2. Ortho convex treemaps
In various treemaps, the aspect ratio cannot be constant and grows with the depth of the tree. When a constant aspect-ratio is required, Orthoconvex treemaps are can be built.
3. Voronoi Treemaps
These treemaps are based on Voronoi diagram calculations, where the algorithm is iterative and does not give an upper bound on the aspect ratio.
4. Jigsaw Treemaps
This treemap is based on the geometry of space-filling curves which guarantee the aspect ratio to be the most at 4. It assumes that the weights are integers and that their sum is a square number and the regions of the map are rectilinear polygons and highly non-ortho-convex.
5. GosperMaps
This treemap is based on the geometry of Gosper curves and has a very high aspect ratio, being ordered and stable, in nature.
When Not to Use a Treemap?
1
When you need accurate size comparisons at higher resolutions
Size distortion can happen when you need to show a greater number of pixels, where you can only optimize for size comparisons at one level of the hierarchy at a time. Usually, all the commercial treemap implementations used gutter borders to show the hierarchy clearly at the expense of size comparisons. However, do not use treemaps if you need to make exact size comparisons.
2
When the chart needs to interpreted in print and cannot be made interactive
Do not use treemaps to compare and represent hierarchical data in print unless you only have a few data points, otherwise, labels can quickly disappear and become unreadable. One can use large format printing to get all the labels, however, treemaps are preferable if interactive.