History of Venn Diagram
When to Use a Venn Diagram?
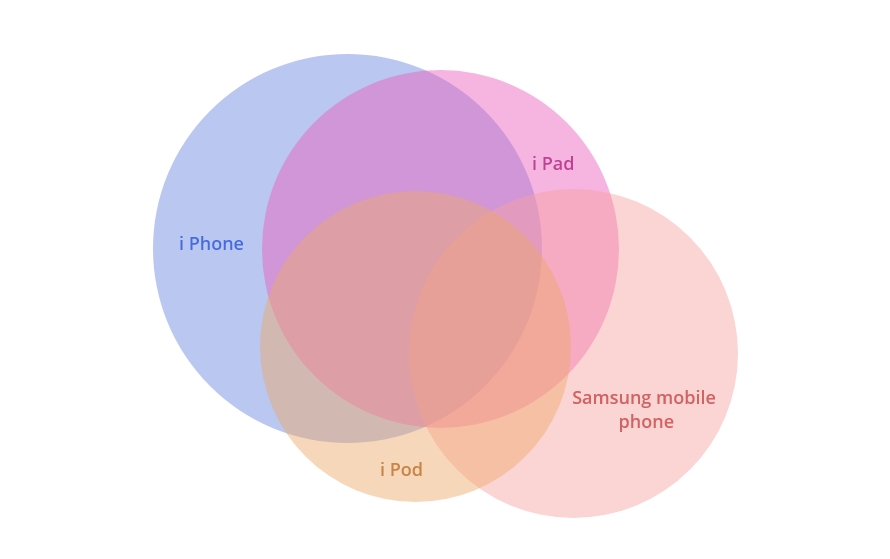
To visualize relationships between sets of items
Use Venn diagrams to graphically organize and compare products, services, processes, or any items depicted as sets, showing commonalities, differences, intersections, unions, symmetric differences, and complements. In design thinking, Venn diagram exercises, effectively clarify overlaps between user needs, business goals, and technical feasibility, making complex relationships visually accessible.
To compare choices and predict probabilities
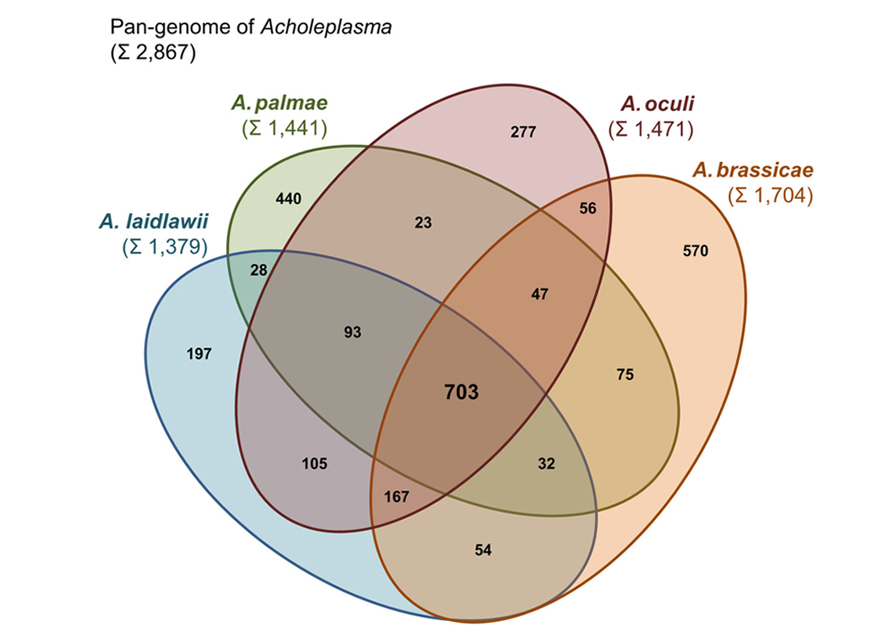
Venn diagram visualization helps analyse data correlations across datasets, such as language commonalities or database overlaps, to predict occurrence probabilities. Area-proportional versions ensure shapes reflect actual element counts, supporting accurate statistical comparisons and predictive analysis.
An area proportional Venn Diagram where each shape is proportional to the number of elements it contains
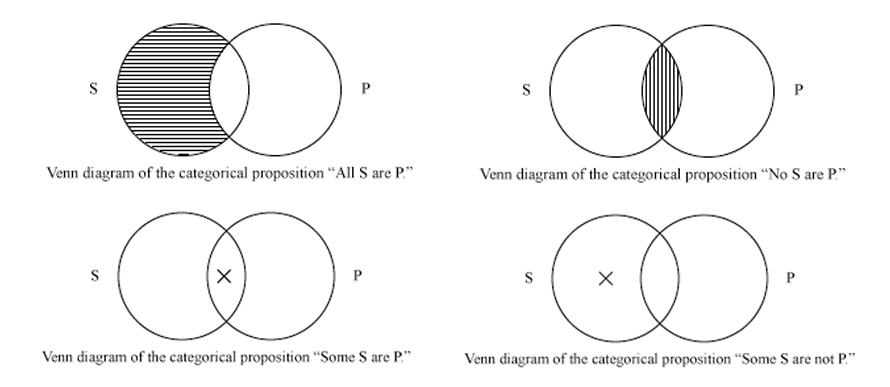
To reason through logic and validate arguments
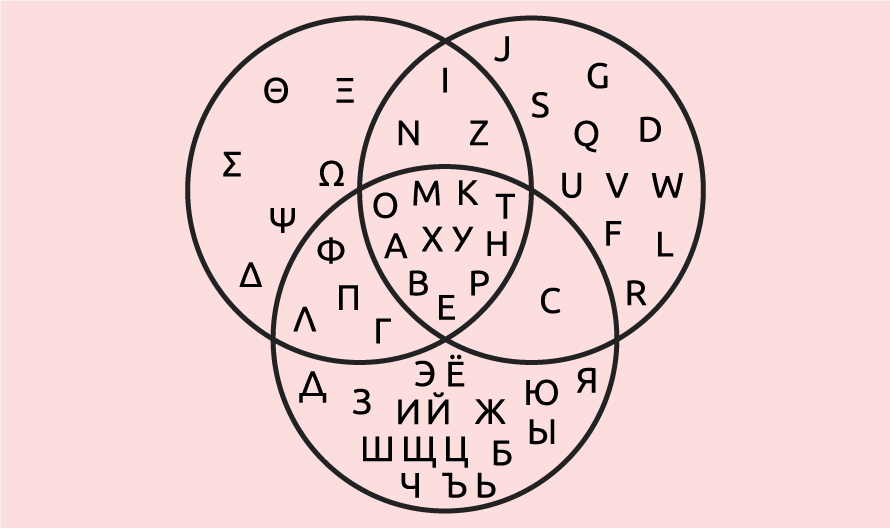
Venn diagrams determine argument validity in deductive reasoning, where true premises and correct form guarantee true conclusions. They map Boolean logic (“and/or”) statements visually, with each region corresponding to truth table rows for propositions like “x in A, x in B.”
Kinds of Venn Diagram
1. Scaled (Area-Proportional) Venn Diagram
Shapes sized by element count for accurate Venn diagram and examples in quantitative comparisons.
2. Randolph (R-) Diagram
Uses intersecting lines for simple logical expressions and set combinations.
3. Euler Diagram
Shows only relevant relationships (unlike exhaustive Venn diagrams), ideal for hierarchies.
When Not to Use a Venn Diagram?
With many object classes
Beyond three circles, kinds of Venn diagram become complex; additional regions risk misinterpretation in large analyses.
When precise comprehension is needed
Venn diagrams represent classes, not individuals, limiting expressive power without custom symbols.