Our Strategy
The Thinker Approach
We evaluated the project requirements and began aligning ourselves with the client’s vision.
After carefully examining the current platform, we conducted a thorough competitor audit to comprehend industry norms in fintech analytics dashboard design and evolving enterprise analytics ecosystems.
We created the UX vision and strategy and recommended adopting the user-centric design methodology according to the scenario.
Insights We Drew/ Insights Inferred
During the initial stages of the project research, we learned about the limitations of the existing platform that required our expertise.
The platform lacked accessibility to data, which slowed down user journeys and exposed gaps in the existing analytics dashboard data design, ultimately impacting the quality of insights users could draw from the presented information.
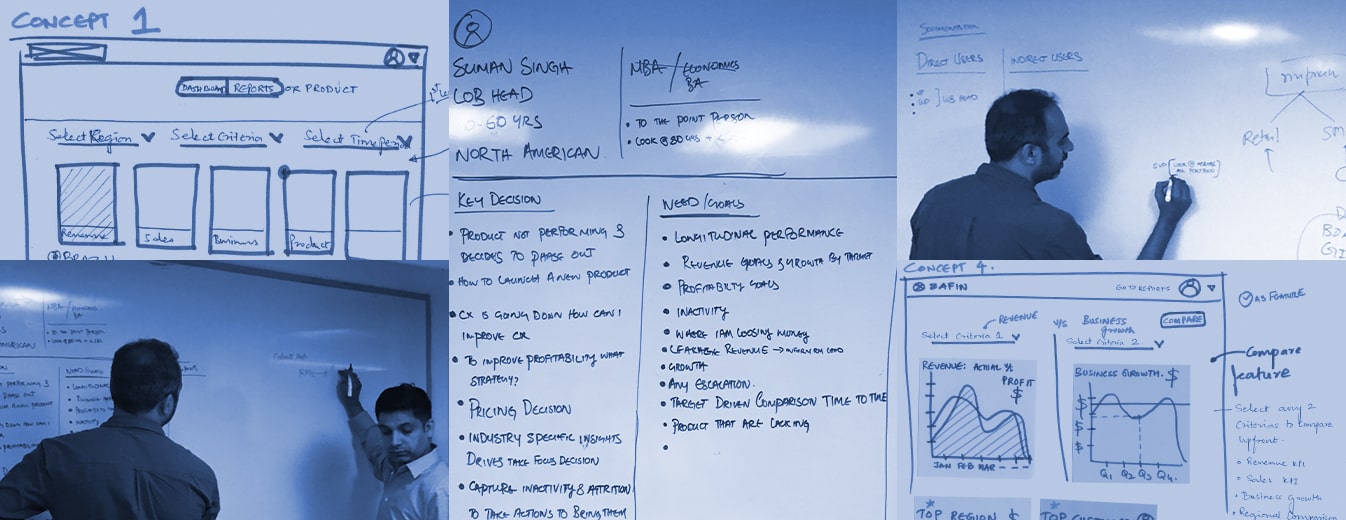
Through primary focus and empathy mapping, we understood user needs. Additionally, using the inputs from stakeholders, we identified user pain points and goals that needed attention.
We used the information garnered from persona mapping to build key workflows for each category of the user.
Key Strategic Interventions
Improved Information Architecture
Optimizing the navigation, filters, and information grouping, establishing a robust information architecture for intuitive access to data within a scalable financial data visualization dashboard environment.
Additional Value Prepositions Across The Dashboard
Incorporation of quick previews to data, widgets for easy information manipulation, and comparison features strengthened the interactive dashboard design, enabling faster evaluation of advantages and trade-offs.
Fluid Framework and Navigation
Workflow-based storyboard, allowing for a fluid framework and navigation to maintain a standard resolution.
KEY FEATURES
01
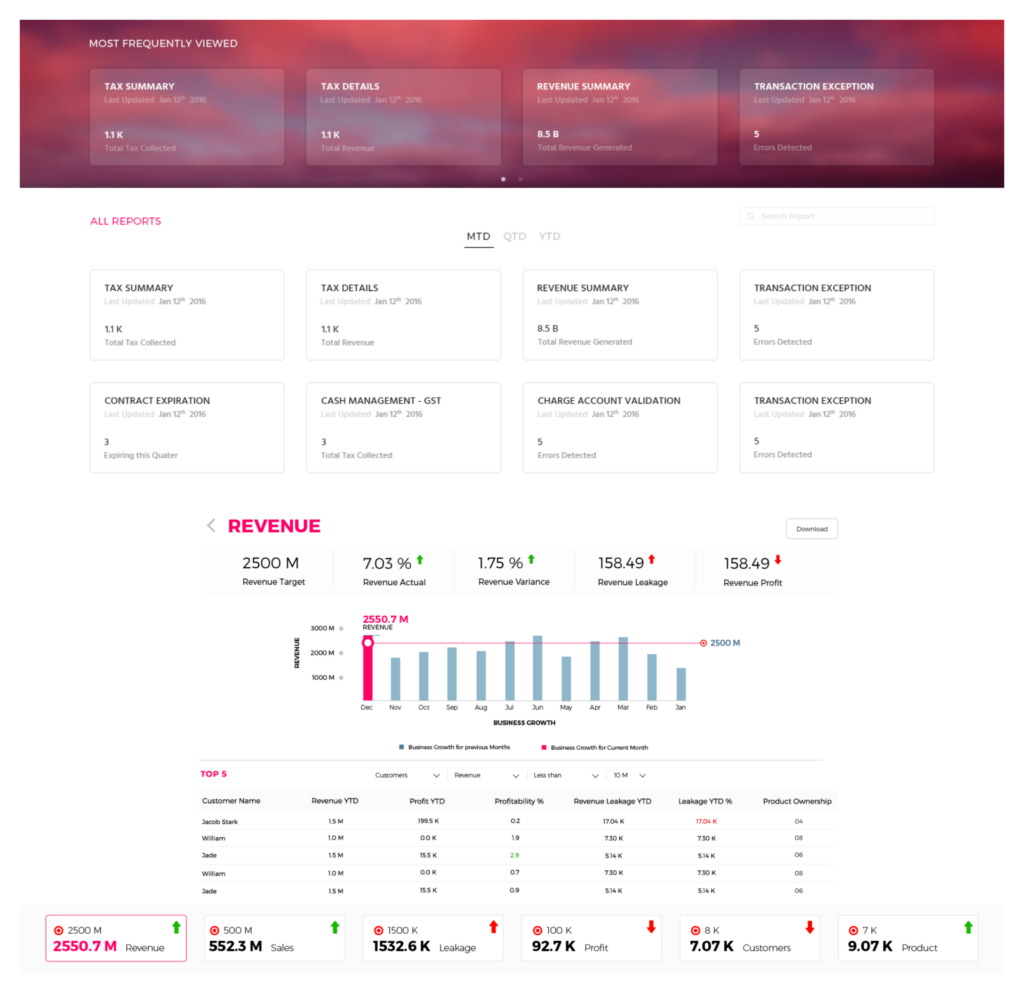
Improved Reporting
We built a self-service portal for enhanced data viewing, giving the user an overview of the stats related to banking. This obliviates the need for blasts of canned reports to the user at regular intervals.
02
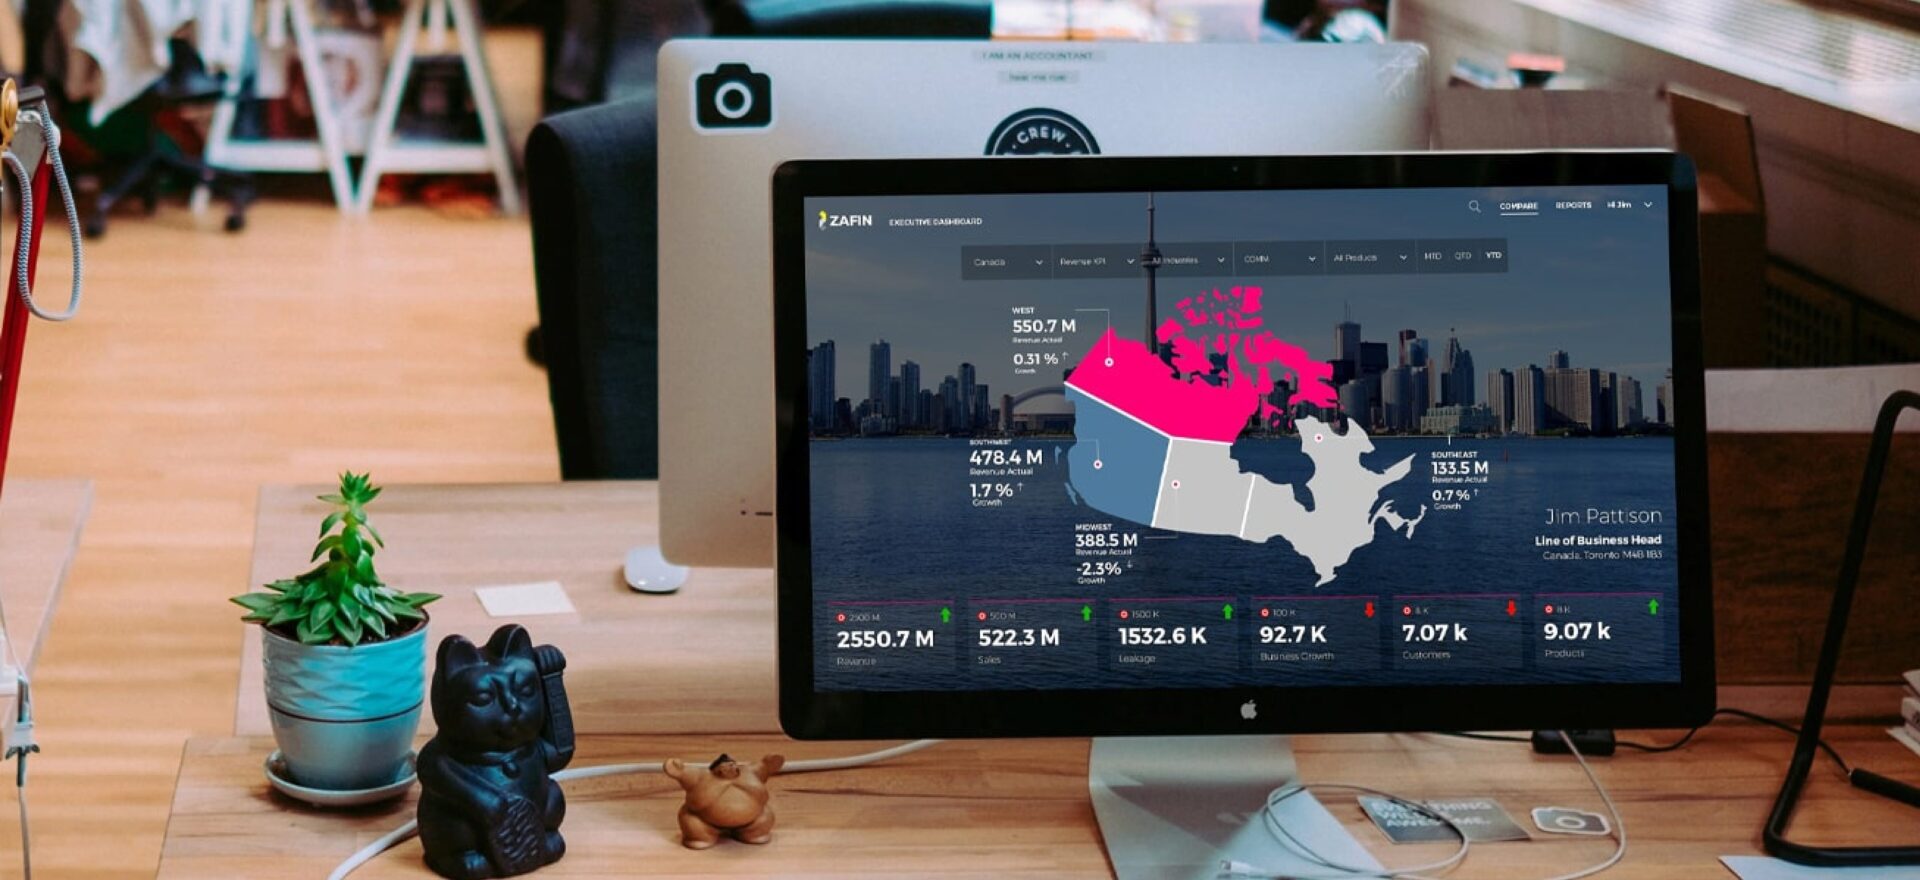
Effective Graphical Representation
With importance to information hierarchy, we designed visual representations of quantitative data with contextual information. This helped users grasp the information more efficiently, drawing insights instantly.
03
Easy Access To Relevant Data
Users can now view data that has been translated into actionable information, allowing them to draw daily insights to make key decisions. They can compare revenues of multiple regions, know revenue leakage for a product, make sure that profit targets are met, and more.
DESIGN ACTIVITIES
Consulting
Stakeholder
Workshop
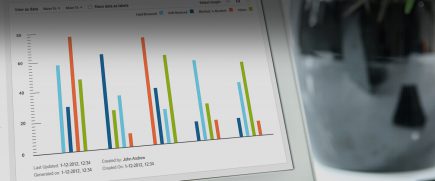
Audit of existing
dashboards
Wireframing
Visual System
Front End
Development
Product Impact & Outcomes
The revamped data product portal of Zafin was launched in early 2018, reflecting a matured financial analytics dashboard UX design strategy.