Data has a lot of untapped potential. However, a dataset that is not classified or grouped does not create meaning for the users. The most important thing to make the data meaningful is to organize the information in a way that the user will easily access and understand. We explore the value of clustering data and how it can unfold patterns that hold a promising key to solving our most complex problems – from the prediction of dangerous earthquake zones to identifying frauds.
Hari Nallan & Mohita Jaiswal - May 2020
Why cluster data?
“Help me understand our customers better so that we can market our products to them in a better manner!”
What would you do if your CMO (Chief Marketing Officer) came up with a request like this and equipped you with customer data?
In specific problems, an outcome needs to be predicted for various sets of conditions. It is different from calculating specific outcomes from your data like calculating the LifeTime Value (LTV) or propensity of cross-sell, when labels to be analyzed are known to us beforehand. But the question posed is broader in its nature because it requires patterns to be discovered within the data, without them being tied down to a specific outcome.
Clustering is an approach that aims to segregate groups with similar traits and assign them into clusters, thereby paving the way to data discovery. Instead of looking at data to confirm one’s own biases, grouping them innovatively can lead one to discover valuable insights.
A story of the decimation of Napoleon’s French army
In 1825, Charles Joseph Minard (1781-1870), a French civil engineer, created a statistical graphic and map to depict the advance into (1812) and retreat from (1813) Russia by Napoleon’s Grande Armé.
As a statistical chart, the brilliance of the map lies as it classifies and unites six different sets of data.
- Geography: Rivers, cities, and battles are named and placed according to their occurrence on a regular map.
- The army’s direction: This is indicated by the color of the path, red leading into Russia, black leading out of it.
- The army’s course: Represented by the path’s flow, which follows the way in and out that Napoleon followed.
- The number of soldiers remaining: This is represented by the width of the path which gets successively narrower, a plain reminder of the campaign’s human toll, as each millimeter represents 10.000 men.
- Temperature: the freezing cold of the Russian winter on the return trip is indicated at the bottom, in the republican measurement of degrees of réaumur (water freezes at 0° réaumur, boils at 80° réaumur).
- Time: in relation to the temperature indicated at the bottom, from right to left, starting 24 October (pluie, i.e. ‘rain’) to 7 December (-27°).
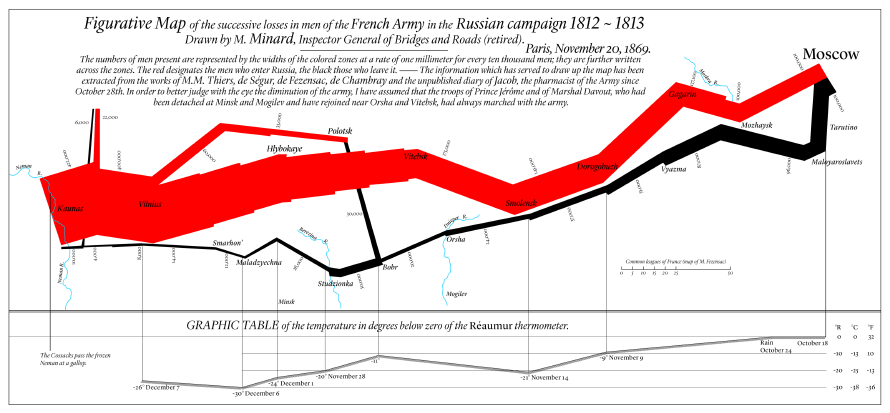
By clustering and correlating data, the visual representation speaks out an insight that changed the course of history.
While Napoleon entered Russia with 442 men, he took Moscow with only 100 men left, wandered around its abandoned ruins for some time, and escaped the East’s wintry clutches with barely 10 shivering soldiers. Napoleon never recovered from this blow and would be decisively beaten at Waterloo under two years later.
Variety of data, various ways to cluster – What are the alternatives we have?
“Information may be infinite, however… The organization of information is finite as it can only be organized by LATCH: Location, Alphabet, Time, Category, or Hierarchy.” — Wurman, 1996*
- Design research offers methods like open card sorting which asks users to sort information into clusters as they see fit. This approach of sorting is useful to improve the usability of a product by gaining an understanding of the user’s mental models.
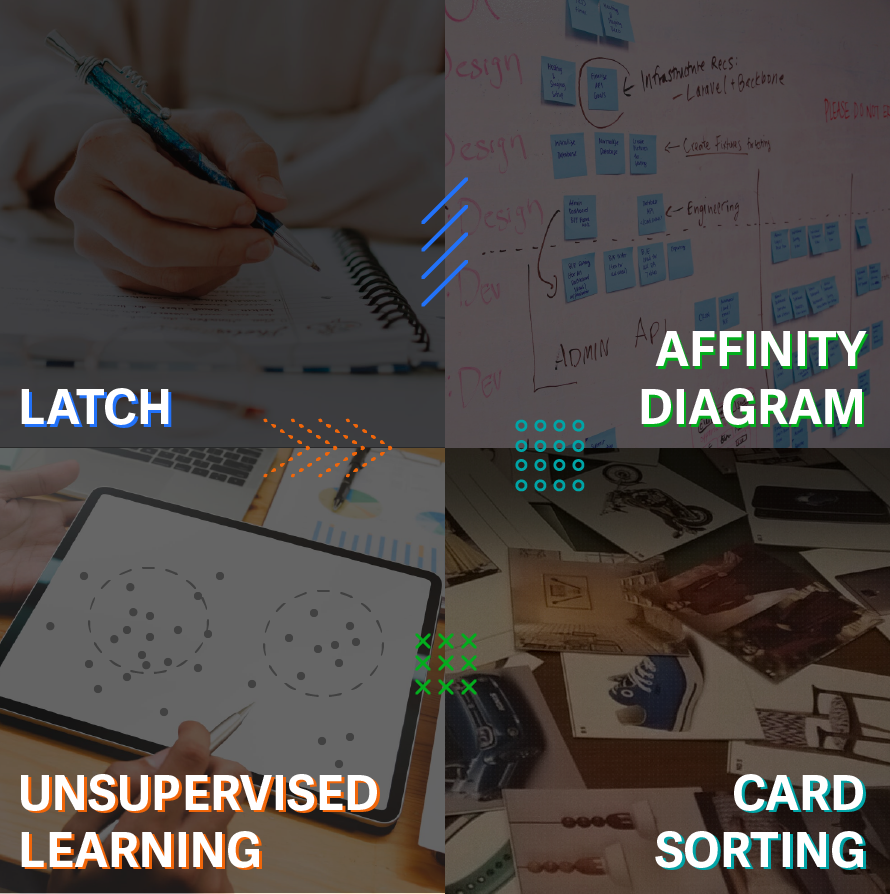
- Affinity Diagram is a method that uses the process of space saturation and grouping to organize large amounts of data into groups or themes based on their relationships, going from analysis to synthesis.
- In AI, clustering is modeled through Unsupervised Learning usually used in pattern recognition problems. No labels are given to the learning algorithm, leaving it on its own to find structure in its input. Unsupervised learning can be a goal in itself (discovering hidden patterns in data) or a means towards an end (feature learning).
Source: Latch Theory
Among all different ways of clustering data, a common aspect is to identify proximity measures – of what makes data points similar to each other, and what makes them dissimilar.
Start by asking yourself.
- What are the various properties of my dataset? (eg. location coordinates, time measure, temperature values, etc.)
- What are the different categories (a unique combination of certain properties) that my data can be classified into? (eg. the course of the army, representing the different location coordinates the army traveled)
- If a property is overlapping in different categories, which one is that more similar to, or dissimilar to?
- Can data be compared across one common property measure and ordered? (eg. age of the army, groups of <20 years, 20-40 years, 40+-year-olds)
How can data be categorized by correlating one property with another property, one property with other properties? (eg. a category of number of soldiers remaining with respect to time, temperature across different time and locations)
Uncover the hidden truths behind data by making different choices
When we think of clustering or grouping data, we usually follow a linear approach or a mental model that limits the possibilities which could be generated. When we widen our frame to accommodate creative problem solving, we might discover a wealth of insight that was before a blindspot.
Mining deeply into dataset properties can help us to find unknowns by reducing the noise, while exploring the breadth by looking for correlations will help us mitigate what one is predetermined to access.
By allowing the user to see the information in a way that is relevant to their goals you will create more usable products. When the user cannot make out the pattern themselves, we need to look at the value clustering, to open a space of possibilities which could create meaningful insights through data.