Data visualizations are required to make complex information easier to understand and effectuate intuitive actions as responses .
As we all stand to face a global pandemic, of proportions never witnessed by many in our lifetimes, it is important to be able to gauge fact from fiction. As we inundate ourselves with an overload of information, it is our impetus to understand what is being shared, stay informed, and avoid alarmist messaging at all costs. In this blog, we share some innovative data visualizations which lately captured attention and made information insightful through an intuitive way of data storytelling.
Vipul Sharma & Mohita Jaiswal - March 2020

Unfolding the COVID story through data
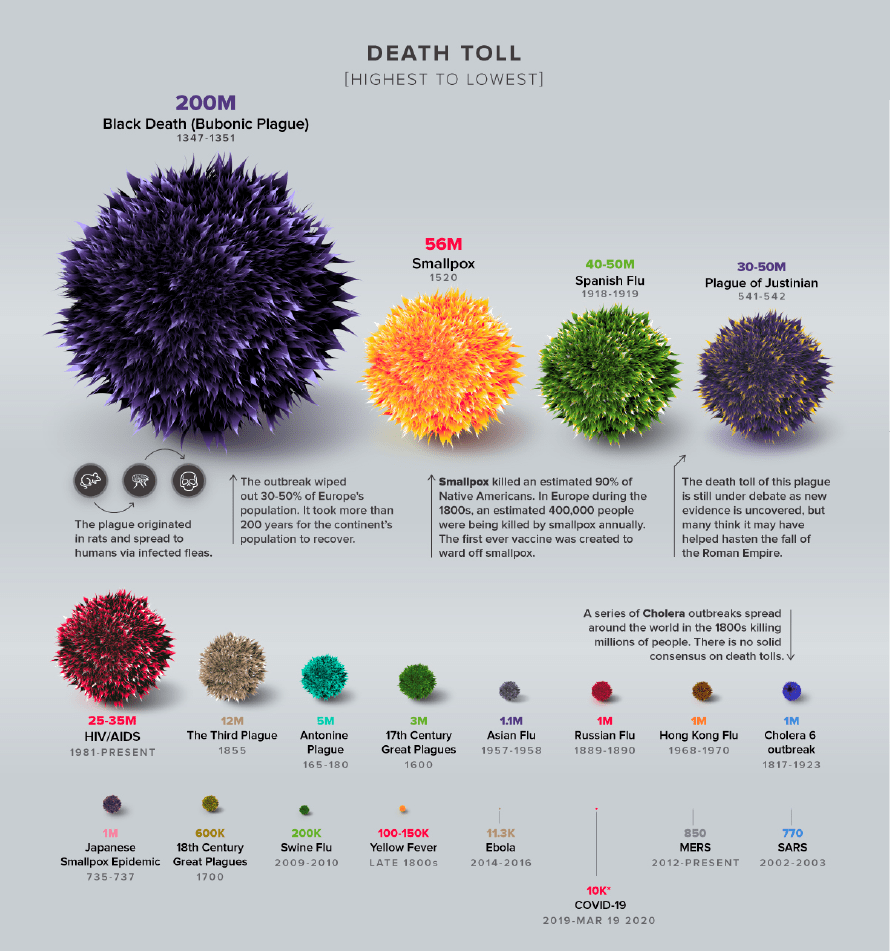
According to the World Health Organization (WHO), a pandemic is a worldwide spread of a new disease. Since the birth of civilization, infections have continued to plague human beings in different forms through different sources. The widespread epidemics like SARS (2002-2003), MERS (2012), Ebola (2014-16), Swine Flu (2009-10) and Novel Coronavirus (present) indicate continued risks of humans to infections in a world of increased opportunities of interactions.
Although advances in medical sciences have been able to mitigate their impact over time, the proportion of a pandemic’s impact makes for staggering numbers in any visual representation of the bigger picture. Here are 5 interesting visualizations which capture the COVID-19 story.
1.Origin: The course from its epicenter
Covid-19 was first reported in Wuhan in December 2019. From Wuhan to the present context, this resource spells out the entire journey of happenings through different visualizations. From flowcharts to spider graphs, sankeys, heatmaps, bar charts, choropleths, and graphic visuals, all have been threaded together in a consistent design language to capture what happened in Wuhan, and the story from there.
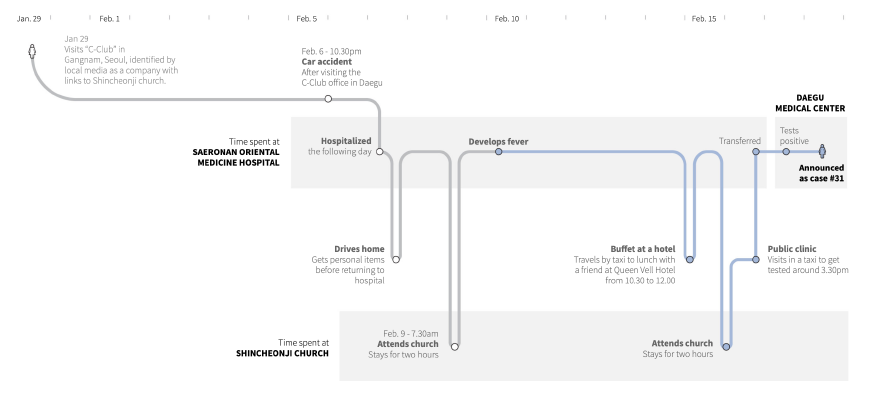
2. Spread: A day in a life of patient 31
Mapping the significant impact one infected person can have on an epidemic, Reuters shares a graphic visualization of Patient 31. Through a data story from the 1st patient to the 31st patient in South Korea, the visualization indicates the number of people who came into contact with the patients and maps out interrelationships between them. Also mapping out the journey of patient 31, before getting tested, the visualization captures the impact it had on the number of subsequent cases, through a simple and visually capturing representation.
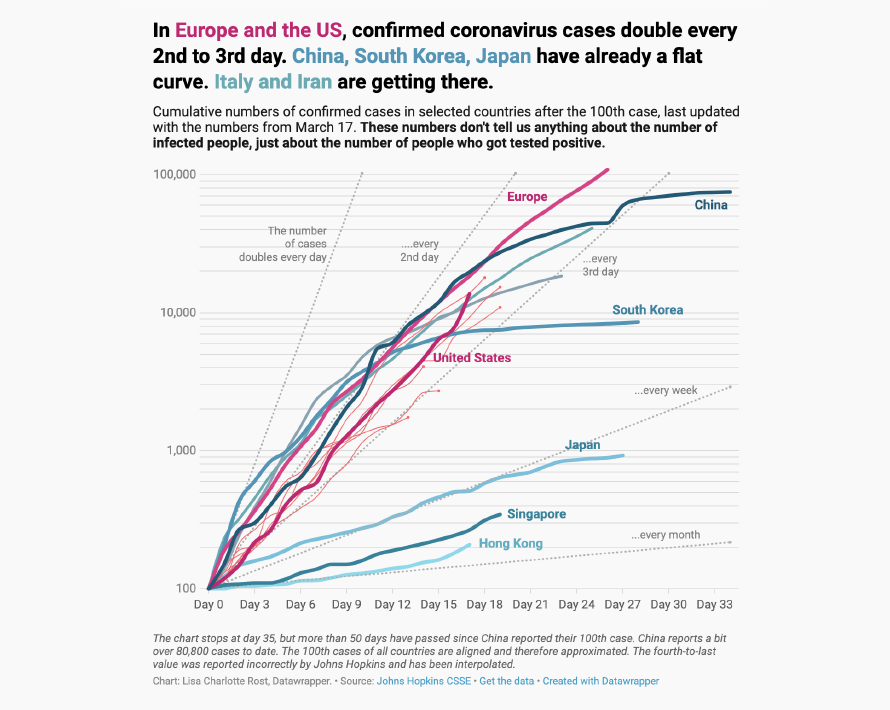
3.Situation: Responsible and positive reporting of global cases
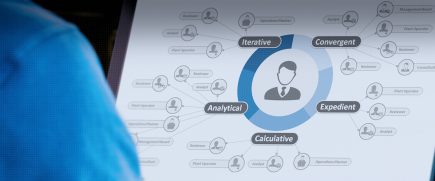
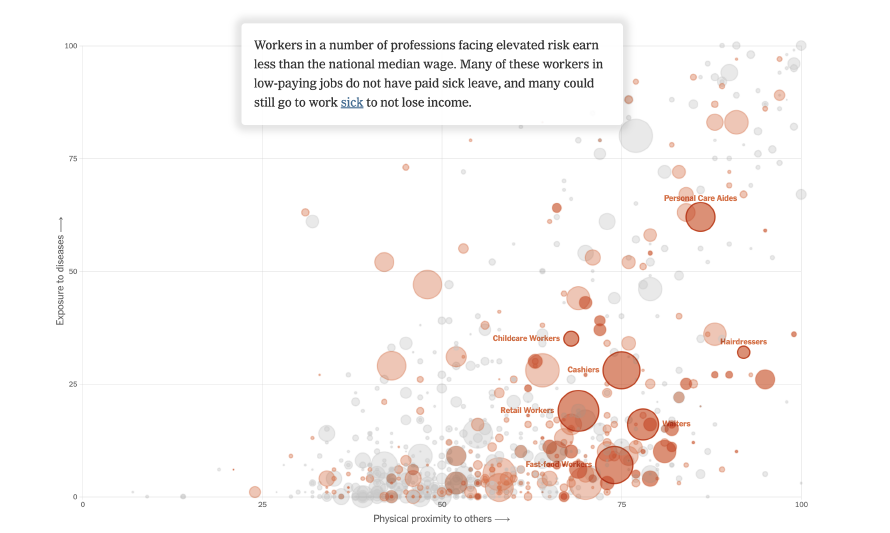
4.Impact: The workers who face the greatest coronavirus risk
This is a simple yet unique visualization with a bubble chart used to indicate the Corona risk of a person based on their job roles. While the bubbles indicate the number of people in a particular job and the income they generate, their daily exposure to disease and proximity to people are plotted on the x and y-axis. The chart has been explained simply through descriptive statements as one engages with it and allows one to search their risk basis their job profiles too.
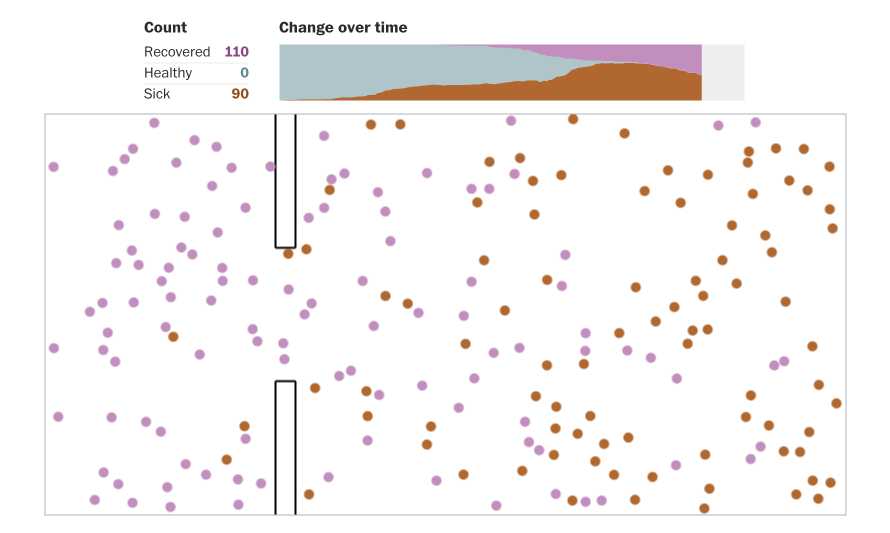
5. Prevention: How pandemics spread exponentially and how social distancing could help
The visualization is a unique representation of the spread and recovery of a population simulated along time factors using dynamic plots. It also compares the simulation across different situations when different kinds of prevention mechanisms have been used to curb the spread, showcasing the most effective solution, as a visual story. Instead of just showcasing different plots of spread, capturing the entire journey of how each plot got created, adds to the intuitive understanding of the charts.
Insights lead to positive actions
In the face of this global pandemic, our best response is individual actions that will collectively have an impact. Data can help us gather insights to take necessary steps* to slow the spread of the virus for eg. self-quarantining and maintaining social distance, as one.
Responsible communication will mean taking a step back to reflect, becoming aware and sharing information with caution while ensuring visual simplicity. It will also mean ensuring that we’re not stigmatizing people who are from countries and regions that have had a lot of cases**.
For the masses to become equipped with insights that are both accurate and neither fear nor hatred based, it is important to first understand how we all are in this together. Then comes designing with simplicity, accuracy, ingenuity and finally an intention of collective goodwill.
**John Hopkins Corona Virus Resource Center: Web-based map to track cases worldwide