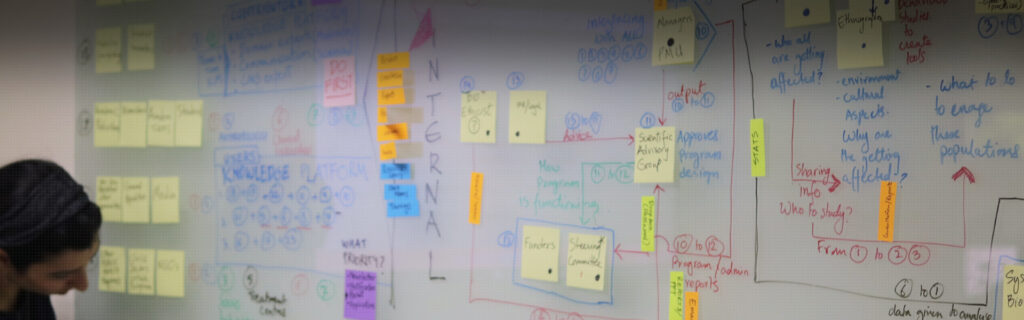
Social Network Mapping
More about Social Network Mapping To understand social network mapping in user research, it is essential first to grasp the concept of social networks. A social network is a platform, physical or digital, where individuals connect as friends, family, colleagues, or people sharing common interests, beliefs, social status, or other interdependencies. In these networks, individuals […]
Diagnosis
Understanding Diagnosis in User and Design Research Diagnosis is a problem-solving approach that typically includes: Detecting symptoms Evaluating symptoms Identifying possible causes Recommending solutions Suggesting improvements When discussing analytical thinking and diagnosis, Thomas Bayes is often referenced. His probability-based theorem is widely used to draw inferences in science and mathematics. Bayesian Thinking Bayes’ theorem helps […]
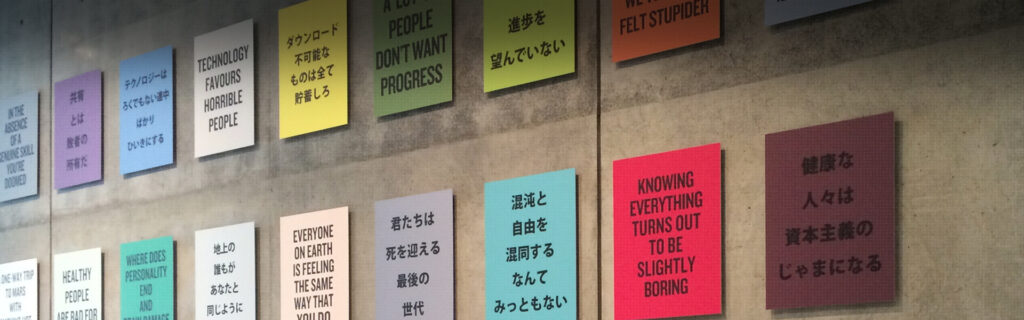
Critical Thinking Research
More about Critical Thinking Research Most research methods rely on experienced or trained researchers to define clear design specifications for a project. In this process, researchers use various techniques to collect and analyze data to develop solutions that align with user needs and expectations. A fundamental skill in achieving optimal outcomes is critical thinking research, […]
Heatmap Analysis
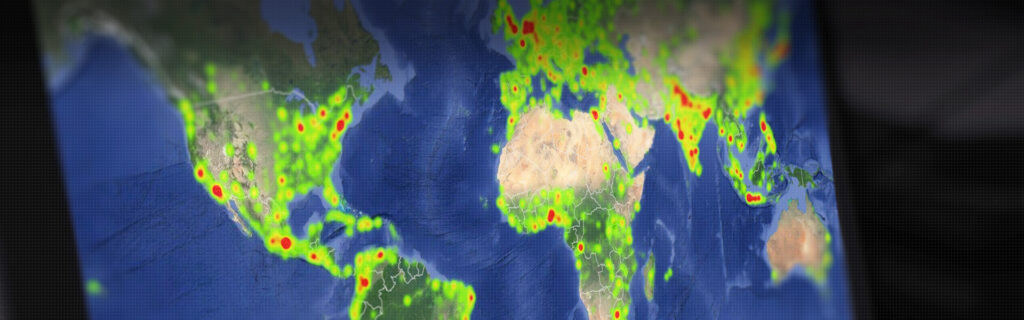
More about Heatmap Analysis Heatmaps use colour gradients to visually represent user engagement data, where warmer colours like red and orange indicate areas with the highest user attention and activity, while cooler colours such as blue and green highlight spots with less interest. This color-coded data is essential for heatmap analysis and heatmap design, helping […]
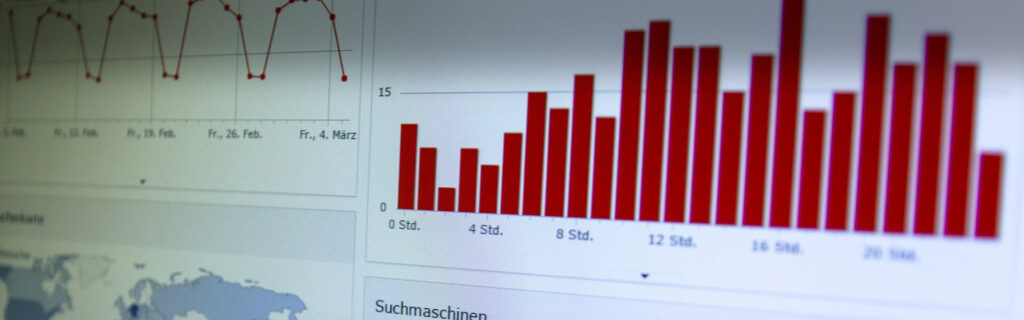
Usage Analytics
Understanding Usage Analytics In design, analytics are tied to product usage, performance, marketing efforts, and design KPIs. Usage analytics is particularly useful for: Optimizing customer journeys and driving intended actions Improving task efficiency in user journeys Identifying bottlenecks and reducing friction User actions—such as clicks, time spent, repeat visits, and task completion—act as indicators of […]
Document Research

More about Document Research This method is not standalone but typically complements other user research techniques. Document research is best suited for answering specific questions rather than open-ended explorations, because the volume of documents can become overwhelming. As a result, it often serves as a supplement alongside surveys, interviews, or ethnography. Alongside surveys and ethnography, […]
Audio Video Analysis in User Research

More about Audio Video Analysis Video is a sequence of images or frames displayed rapidly to create the illusion of continuous motion. Typically, videos run at 24-30 frames per second (fps), meaning a 5-second video at 15 fps consists of 75 individual frames. Alongside visuals, videos usually include an audio track. In research, audio and […]
Time Lapse Video
Understanding Time Lapse Video A video is a sequence of pictures stitched together to create the impression of motion. Most videos run at 24–30 frames per second, which means a 5-second video at 15 fps contains 75 frames. Time-lapse video is an observation tool that researchers use to record, review, and analyse user behaviour or […]
Trend Analysis Research
More about Trend Analysis Research The goal of trend analysis is to identify prevalent patterns within a user group and understand how these trends develop or evolve over time. This process is essential for uncovering new opportunities and generating innovative ideas for products or concepts, making it a valuable step early in the design phase. […]