In the increasingly competitive landscape of digital products and services, user experience (UX) has emerged as a critical factor that determines the success of digital products or services. While traditional market-oriented performance indicators such as revenue, market share, and overall profit remain important to gauge the business and its success, KPIs that help us monitor user experience offer a more nuanced understanding of how users interact with and perceive a product. These KPIs focus on the user’s journey, overall consumer satisfaction, and engagement, providing stakeholders, designers, developers, and writers with actionable insights for continuous improvement.
Stuti Mazumdar & Vidhi Tiwari - July 2024

Understanding UX-led Key Performance Indicators
UX-led KPIs are metrics specifically designed to measure the quality of the users’ experience with digital products, that is, their overall user experience. They go beyond the basic usage statistics to capture how users feel, how efficiently they can complete tasks, and how likely they are to continue using the product using digital tools to track and analyze user behavior. By focusing on these aspects, businesses can identify user pain points, enhance user satisfaction, and garner a community of loyal users dedicated to helping the business improve with insightful feedback.
Key UX-led Key Performance Indicators
As mentioned earlier, while we value the traditional KPIs—including session duration, conversion rate, and retention rate to name a few, the digital age calls for some changes. We’ve picked out some KPIs that every designer should closely monitor and track for their design project.
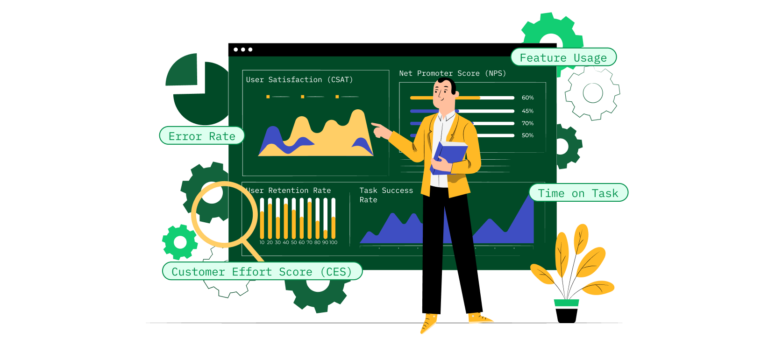
1. User Satisfaction (CSAT)**
Customer Satisfaction Score (CSAT) is a fundamental KPI that measures user satisfaction for a particular feature, in-app interaction, or the overall product. Typically, CSAT is gathered through surveys where users rate their satisfaction on a scale (for example, 1-5 or 1-10). A high satisfaction score indicates that users are pleased with their experience, which can lead to higher retention rates. Monitoring CSAT helps identify areas of success and aspects needing improvement, allowing for targeted enhancements to boost user happiness.
2. Net Promoter Score (NPS)
Net Promoter Score (NPS) assesses the likelihood that users will recommend the product to others and gathers the overall experience of the product. This is measured by asking users to rate their likelihood of recommending the product or service on a scale of 0-10. Scores of 9-10 are categorized as promoters, 7-8 as passives, and 0-6 as detractors.
A high NPS indicates strong user loyalty and satisfaction, which can drive organic growth through word-of-mouth recommendations. Understanding NPS helps in identifying brand advocates and areas where user experience can be improved to convert detractors into promoters.
3. Task Success Rate
As we slowly transition into the technical end of things, a key KPI measured at the usability testing stage of the design process is the Task Success Rate. Task Success Rate measures the percentage of tasks that users can complete successfully without errors.
This metric is often observed through user testing or in-app analytics that track user interactions. High task success rates suggest that the product is intuitive and easy to use, reducing user frustration and bounce rate. Analyzing this KPI helps identify and address usability issues, ensuring that users can efficiently achieve their goals without unnecessary obstacles.
4. Time on Task
Like the previously mentioned KPI, this one can also be measured during user testing. Time on Task measures the amount of time users take to complete a specific task. This metric is tracked through analytics tools that monitor user interactions. Shorter times typically indicate an efficient and user-friendly interface, while longer times may highlight usability issues or complex processes.
By evaluating Time on Task, product teams can streamline workflows and simplify interfaces to enhance user efficiency and satisfaction.
5. User Retention Rate
User Retention Rate is the percentage of users who continue to use the product over a specific period or, continue to remain on the website for longer periods of time. This metric is calculated by tracking returning users across defined intervals, such as weekly or monthly. High retention rates are indicative of a valuable and satisfying user experience.
Monitoring retention helps in understanding user loyalty and the long-term value of the product, guiding strategies to improve user engagement and reduce churn.
6. Error Rate
Error Rate is the frequency of errors encountered by users during their interactions with the product. This KPI is monitored through analytics tools and user feedback. Lower error rates signify a more reliable and user-friendly product, as users can complete tasks without encountering issues.
In case of high error rates, consider decreasing the complexity of the design features or providing clear and effective copy across the product to make it easy for users to complete their user journey. Identifying and reducing errors is crucial for enhancing the overall user experience and ensuring that the product functions smoothly.
7. Customer Effort Score (CES)
Customer Effort Score (CES) measures how much effort users have to put in to achieve a task or resolve an issue. This is typically survey-based, asking users to rate the ease of their experience on a scale. A lower effort score indicates a smoother and more satisfying user experience, as users can accomplish their goals with minimal frustration. A low score amounts to higher user satisfaction, ultimately converging them into a loyal user.
CES helps pinpoint areas where the user journey can be simplified, leading to increased satisfaction and loyalty.
8. Feature Usage
Feature Usage tracks which features are used most frequently and how often. This metric is analyzed through in-app analytics that monitor user interactions. Understanding feature usage helps identify popular features and potential areas for improvement or further development.
By focusing on the most valuable features, product teams can enhance the overall user experience and ensure that the product meets user needs effectively.
Implementing UX-led Key Performance Indicators
It is essential that every corporation or organization embed timely monitoring and assessment of KPIs for their products or services to ensure actionable insights are determined for routine upgrades of their digital product.
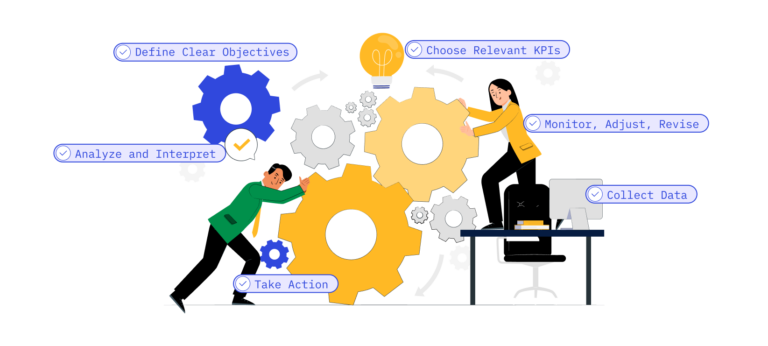
Step 1: Define Clear Objectives
Start by defining clear objectives for what the organization wants to achieve. These may be long-term, such as user retention or user satisfaction that are built over time, or short-term goals, such as higher CTRs on a singular button. These objectives should align with the overall business goals and user experience strategy, ultimately helping the team shortlist and categorize the KPIs that need to be monitored regularly.
Step 2: Choose Relevant KPIs
Select the KPIs that best align with the objectives finalized in Step 1. It’s essential to remember: focus on a few key metrics rather than trying to track everything at once. This helps maintain clarity and ensures that the efforts are concentrated on the most impactful areas of the project.
Step 3: Collect Data
Use a combination of online tools and strategies to gather data. This can include surveys, analytics platforms, usability testing, direct user feedback, and user interviews. Ensure that the data collection methods are consistent, reliable, and thorough.
Step 4: Analyze and Interpret
Analyze the data collected by the team to identify trends, patterns, and areas for improvement. After all, the data is literally a sneak peek into the overall user experience of users globally. Look for correlations between different KPIs to understand the aspects of the app or website that can use a change in design or communication to the user.
Step 5: Take Action
Use the insights gained from the analysis to make informed decisions about product improvements. Prioritize changes that will have the most significant impact on user satisfaction and overall experience.
Step 6: Monitor, Adjust, Revise
Continuously monitor the chosen KPIs to track the impact of all the design changes implemented by the team. The insights report generated through this exercise should be shared by stakeholders, designers, and other related parties routinely. Be prepared to adjust the overall strategy based on the ongoing feedback and evolving user needs.
Challenges and Considerations
Of course, every organization faces roadblocks when implementing something new in their pre-existing design and business framework. However, embedding a requirement as critical as KPI mapping and monitoring is essential. But the following considerations are to be made when facing these challenges.

1. Incorporating Quantitative and Qualitative Data
While quantitative data provides measurable insights for a lot of critical business reports, qualitative data offers a deeper understanding through user pain points, stories, feedback, and candid observations. Ensuring that both types of data are incorporated into the strategy can provide a more comprehensive view of the overall user experience.
2. Ensuring Data Accuracy
Accurate data collection is crucial to draw meaningful insights. Incomplete or incorrect data may lead to a waste of a user testing exercise—or worse, changes in the design that were doing well in promoting user satisfaction. Ensure that the data sources are reliable and that the team is interpreting the data correctly at all times, especially when they’ve automated certain parts of the process. Regular audits and validation checks can help maintain data integrity.
3. User Privacy and Ethics
Respecting user privacy and adhering to ethical standards is essential when collecting and analyzing user data. To begin with, it is ideal to be transparent with users about the data that is being collected. You may go a step further and explain to them how it will be used and ensure compliance with relevant regulations.