Venn Diagram
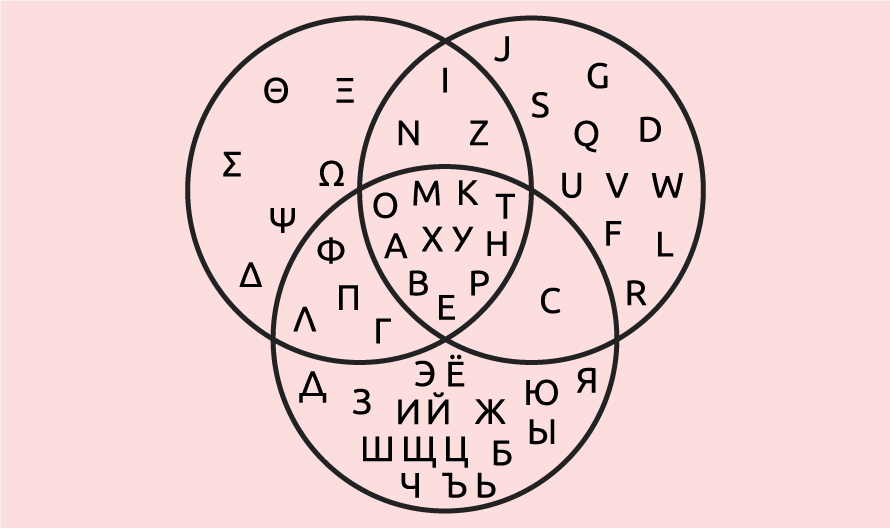
History of Venn Diagram These charts were first mentioned in the 1880 paper entitled “On the Diagrammatic and Mechanical Representation of Propositions and Reasonings” in the Philosophical Magazine and Journal of Science. But the roots of these types of charts go back much further, at least 600 years. In the 1200s, philosopher and logician Ramon […]
Sankey Diagram
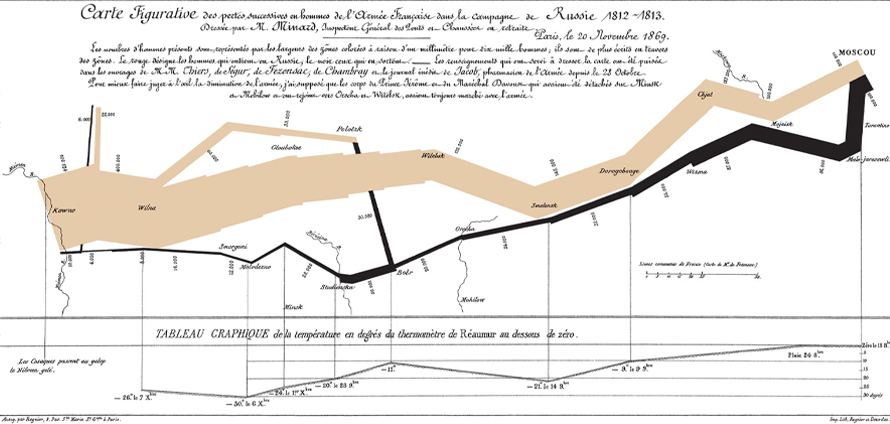
Sankey diagrams are a type of flow diagram which is used to represent energy inputs, useful output, material flows, cost breakdowns and wasted output, etc. The entities being connected are called nodes and the connections are called links in which the width of the arrows/links is proportional to the flow rate and are used to […]
Network Diagram
History of Network Diagram Node–link diagrams trace back to the 13th century work of Ramon Llull, who drew diagrams of this type in order to analyze all pairwise combinations among sets of metaphysical concepts. However, the basic idea of graphs was first introduced in the 18th century by the Swiss mathematician Leonhard Euler, whose attempts […]
Geographic Network Diagram
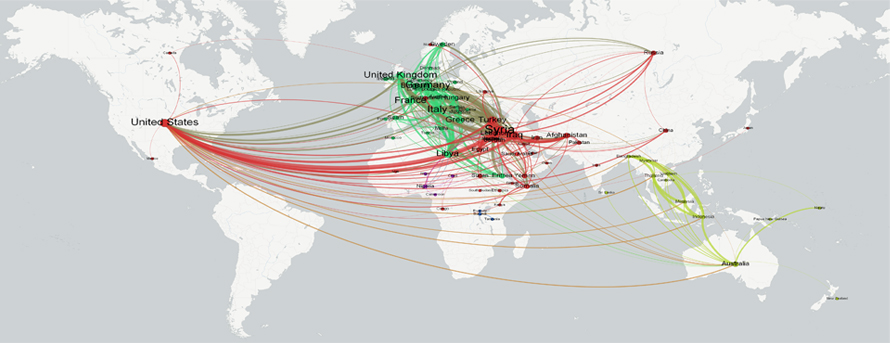
Geographically-situated networks, in which nodes are placed in space at their actual geographic locations, offer an incredibly rich new analytic framework that blends spatial and non-spatial connectivity in a single visual. A graph is the mathematical abstraction of a network. It consists of vertices and edges connecting those vertices. A geographic graph is a graph […]
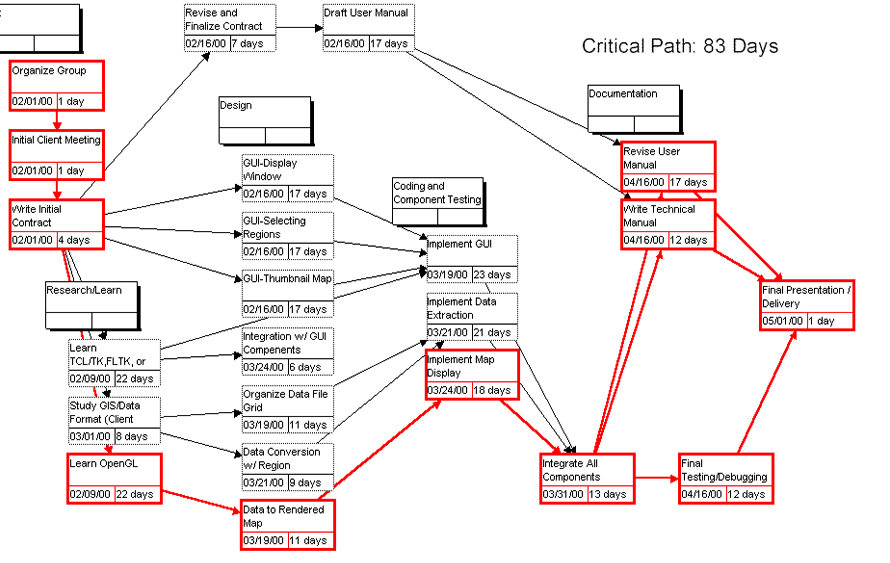
Gantt Chart
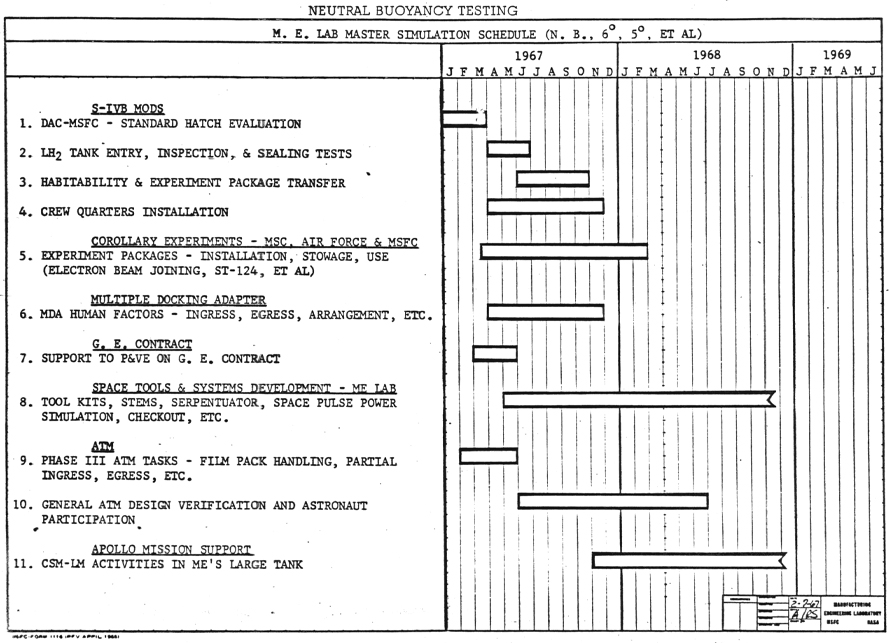
A Gantt chart visualization shows activities (tasks or events) displayed against time, most commonly used for the purpose of project management and scheduling. On one axis is a list of the activities and along the other is a suitable time scale. Each activity is represented by a bar; where the position and length of the […]
Chord Diagram
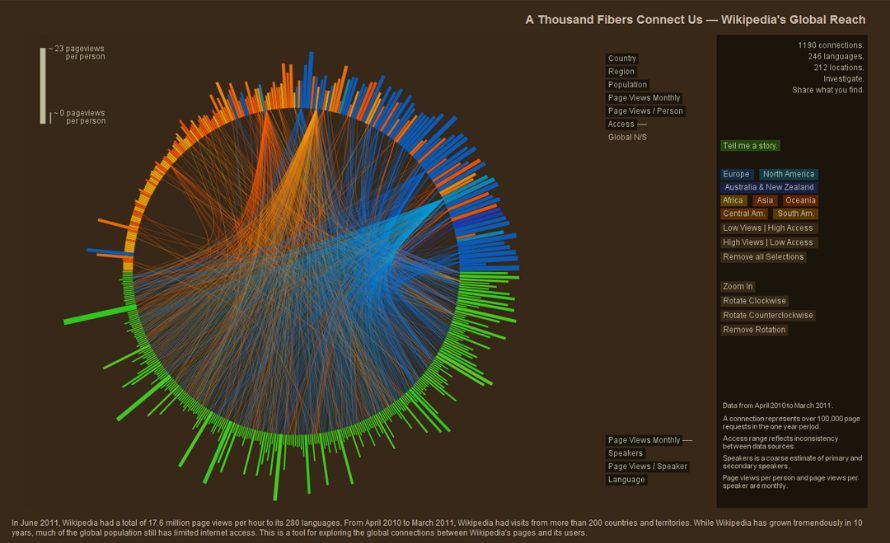
A chord diagram is a graphical method of displaying inter-relationships between data radially around a circle. It represents flows or connections between several entities (called nodes) with the relationships between the nodes typically drawn as arcs connecting the data. Here the size of the arc is proportional to the importance of the flow. Chord diagrams […]