Venn Diagram
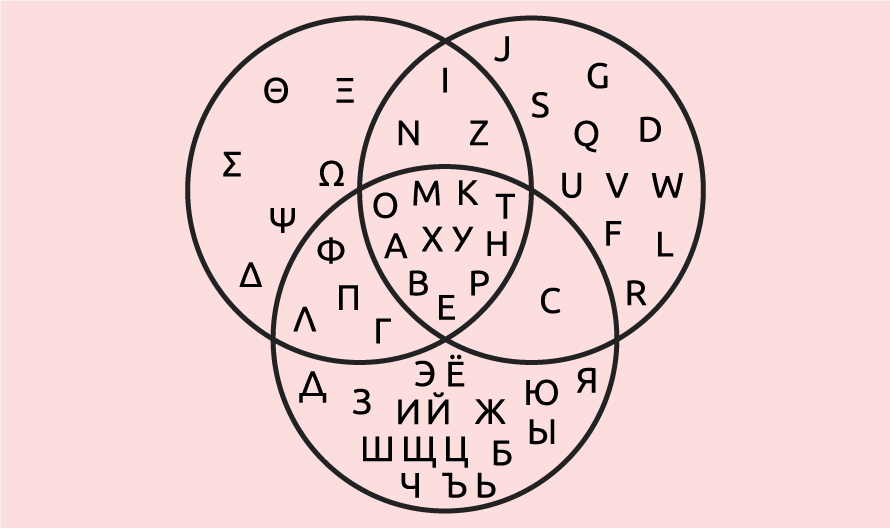
History of Venn Diagram John Venn first described these diagrams in his 1880 paper “On the Diagrammatic and Mechanical Representation of Propositions and Reasonings.” Roots trace back 600 years to Ramon Llull (1200s) and Gottfried Wilhelm von Leibniz (late 1600s), with similarities to Leonhard Euler’s 18th-century diagrams. Venn diagram showing the uppercase glyphs shared by […]
Sankey Diagram
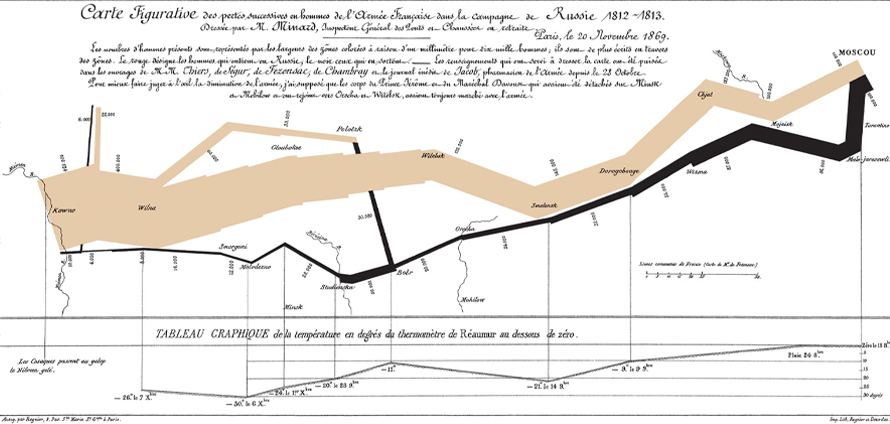
Hisory of Sankey Named for Irish Captain Matthew Henry Phineas Riall Sankey, who in 1898 charted steam engine efficiency with width-proportional arrows showing heat loss. Originally monochrome for single flows, color unlocked multiple variables. Charles Minard’s legendary 1812 Napoleon Russia campaign map layered Sankey flow over geography—a timeless design masterpiece. Sankey’s original 1898 diagram showing […]
Network Diagram
History of Network Diagram Node-link diagrams trace to 13th-century Ramon Llull’s metaphysical concept combinations. Swiss mathematician Leonhard Euler formalized graph theory in the 18th century, solving the legendary Königsberg bridge problem, proving no single walk could cross all bridges exactly once. Internet growth elevated network analysis across disciplines. Euler’s approach to solving Königsberg bridge problem, […]
Geographic Network Diagram
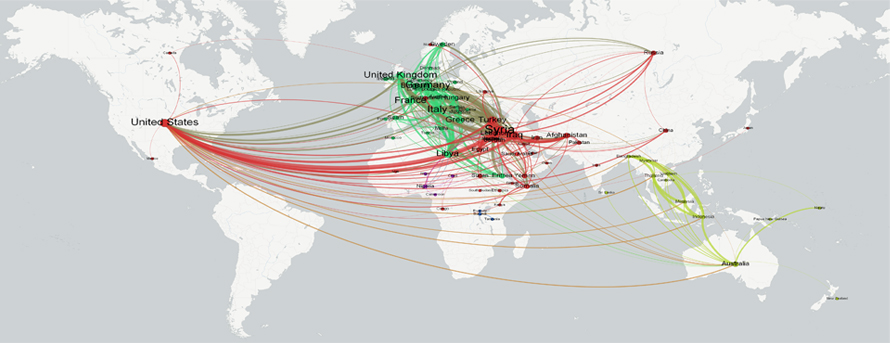
History of Geographic Network Diagram Spatial networks emerged in 1970s quantitative geography, building on mathematical graph theory from physics and sociology. Early studies analysed location, activities, flows, and evolving transportation networks, though limited by data and computing power. Today, geographic networks integrate statistics, probabilities, and real-world stochastic processes. Map showing the Geographic Networks of Global […]
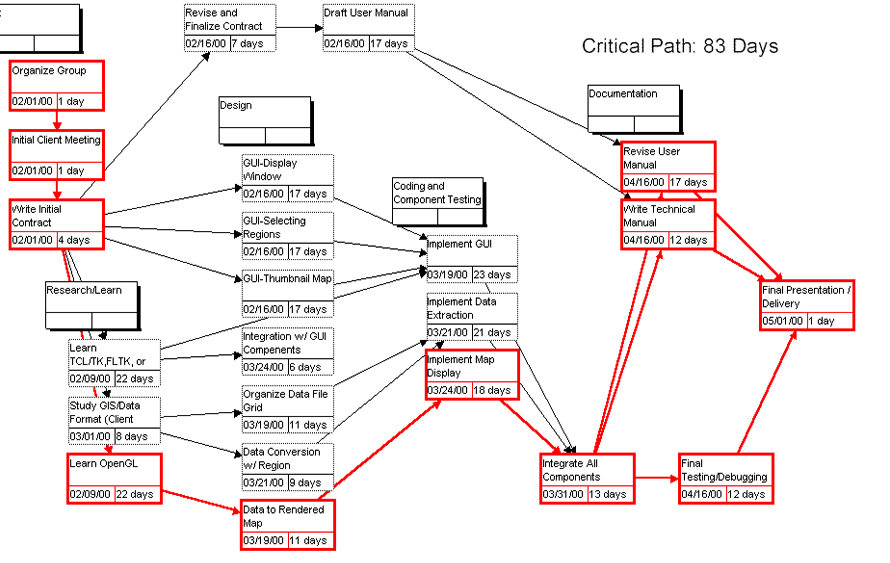
Gantt Chart
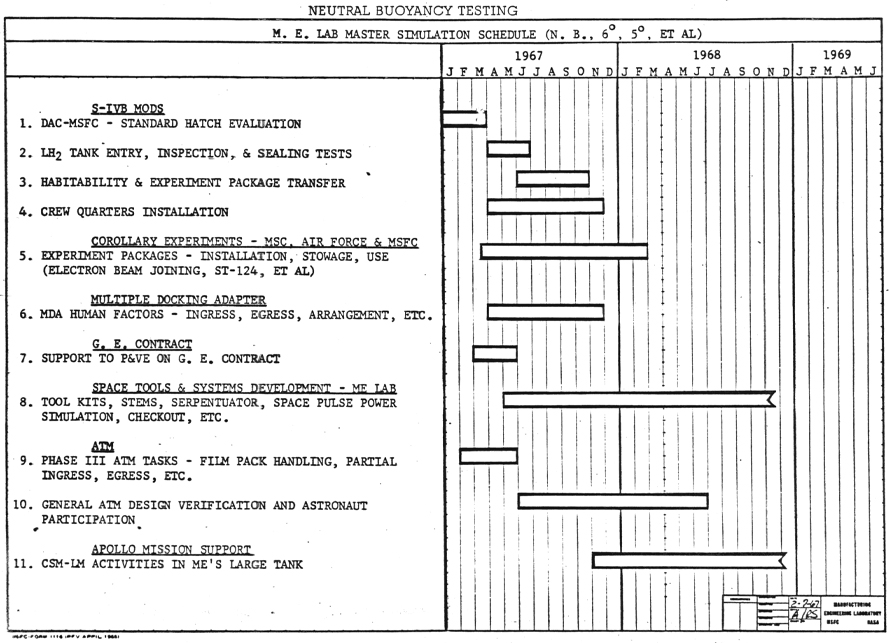
History of Gantt Chart The first Gantt chart precursor, known as the harmonogram, was devised in the mid-1890s by Polish engineer Karol Adamiecki. Around 1910, American engineer Henry Gantt created his version, which gained widespread popularity in Western countries. Early Gantt charts were handmade, requiring complete redraws for schedule changes until computers automated adjustments by […]
Chord Diagram
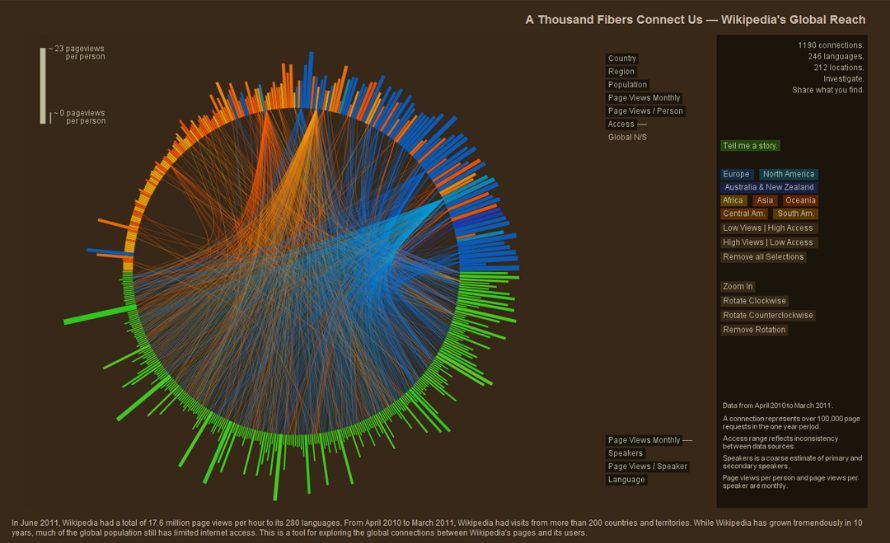
History of Chord Diagram The term chord diagram derives from geometry, where a chord is a line segment connecting two points on a circle. Chord diagrams gained prominence in 2007 through The New York Times infographic “Close-Ups of the Genome,” showcasing genomic relationships. Also known as radial network diagrams, they represent a specialized circular chord […]