Unlock the Power of Your Data with Our Visualization Services
In today’s data-driven world, clear and compelling communication of insights is essential. Our data visualization and data design services use advanced interactive techniques to convert complex datasets into meaningful visual stories. At Think Design, we don’t just create visuals, we empower your organization to harness the full potential of your data, enhancing business intelligence and driving informed decisions.
As of 2025, only 26% of employees in large organizations have access to business intelligence tools, revealing a significant gap in data accessibility. To enable non-technical users to make informed decisions, data must be presented in a clear, engaging, and easy-to-understand format. According to the BI Scorecard by Howson Cindi, “BI Adoption Remains Flat,” underscoring the challenge of broadening BI adoption.
Raw numbers can be overwhelming and may hide critical insights, but effective data visualization cuts through the complexity and delivers information directly. We close the gap between data and comprehension by transforming complex analytics into compelling visual stories that empower your team to make smarter, faster decisions.
With our expertise in data visualization and data design, we help decision-makers intuitively leverage business intelligence. Future-proof your organization by fostering a data-driven culture that supports informed strategies. Empower your people with intuitive visual discovery tools and smarter, actionable solutions.
Our Approach to Crafting Interactive Data Visualization Solutions

Bridging the Gap Between Decision Makers and Analysts
We focus on aligning what decision-makers truly need with what analysts deliver. By thoroughly understanding user needs and the stories behind the data, we create interactive, insightful, and actionable data visualization solutions that drive better business outcomes.

Understanding Data Visualization Hierarchy
Data visualization has a natural hierarchy, identifying key performance indicators (KPIs) comes before exploring detailed drilldowns. By comprehending the business domain and the perspective of data users, we design hierarchical visual configurations that are meaningful and intuitive.

Enhancing User Interactivity
Whether it’s dashboards, reports, data products, or portals, user interaction is key. We prioritize delivering relevant information and metrics while also focusing on how users engage with each element to uncover their own insights. User research informs our approach to meeting analytical, and interaction needs.

Choosing the Right Visual Charting Techniques
With numerous chart types available, selecting the best visual representation depends on both theoretical knowledge and practical experience. Our framework guides the choice of appropriate charts based on the data context and the insights required, ensuring clarity and impact in every visualization.
At Think Design, we developed a simple yet powerful framework that helps design practitioners, both within our organization and beyond, make effective design choices. This framework supports intuitive data visualization and visual data discovery, enabling users to quickly grasp key insights and make informed decisions. By streamlining the design process, we ensure that every visual element enhances clarity and drives meaningful understanding of complex data.
Think Design’s Data Visualization Framework
Discover DISTRIBUTION
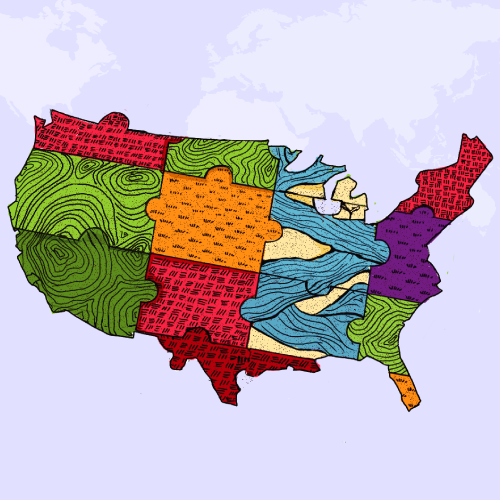
Understand how your data is spread across regions/median and determine inconsistencies.
Discover CHANGE
Understand how your data changes with changes in other factors and predict trends.
Discover INTERCONNECTION
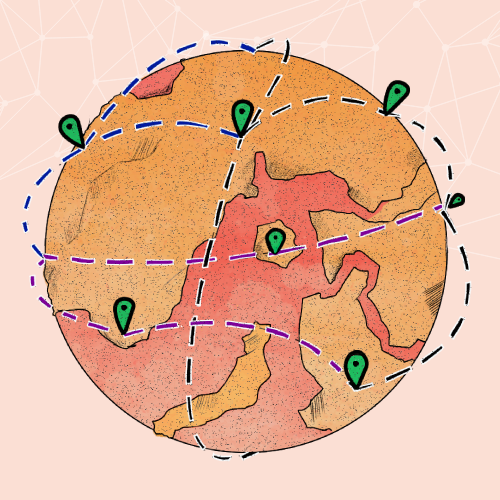
Understand what your data is interconnected to and discover the way it flows.
Discover RANK
Understand how your data points are comparable and the way they can be ordered.
Discover PROPORTION
Understand what your data is made up of and see the parts of the whole.
How to use the framework
For any business use case, it is of value to pick at least one data chart from each of the different 5 nodes available. To analyze and gather insights comprehensively, discover change, composition, distribution, rank, and interconnections in data.
For example, looking at Climate Change data, one can gather various insights. Some of the questions we can ask and find answers for, through a chart from each category are:
CHANGE
How has climate changed over a period of 10 years?
PROPORTION
What is the percentage contribution of different factors which has led to climate change?
RANKING
What is the comparison of carbon emissions from developed countries. Who is the top contributor and who is the least?
DISTRIBUTION
What is the distribution of temperature rise across the globe?
INTERCONNECTION
What are the interconnections between risks associated with climate change (economic, societal, technological, environmental, geopolitical)?
Effective visualizations, designed with the audience in mind, transform complex data into clear insights by filtering out irrelevant information. By delivering these insights in an engaging format, we not only enhance comprehension but also create memorable experiences that drive informed and decisive action.

TABLEAU

POWER BI

D3.JS

INFORMATION DESIGN
KPIs & CONTENT

PUBLISHING TOOLS

UI, UX AND JOURNEYS

WEB TECHNOLOGIES
CHART API
DATA VISUALISATION CHARTS
End-to-End Design Expertise
Expert Perspectives on Design
In today’s data-driven world, organizations are flooded with data as a consistent stream of numbers, charts, and raw datasets. However, without context, data often remains a collection of abstract figures, struggling to resonate with the overall experience one tries to
In today’s data-driven world, organizations are flooded with data as a consistent stream of numbers, charts, and raw datasets. However, without context, data often remains a collection of abstract figures, struggling to resonate with the overall experience one tries to
Let's bring your ideas to life
Partner with a Trusted Global UI/UX Leader
Frequently Asked Questions
At Think Design, we believe data visualization is about transforming raw data into actionable insights that fuel organizational intelligence. Our approach is rooted in a deep understanding of both qualitative and quantitative data, ensuring we choose the appropriate visual charting methods to convey the right message.
We start by understanding the user – their goals, technical literacy, and what they need to know from the data. This user-first approach, combined with our Data Visualization Framework, allows us to craft interactive data visualizations that are not only visually appealing but also highly effective in communicating complex information. We’re not just visualizing data; we’re enabling a pervasive shift towards data-driven user experiences.
Our approach to custom data visualization solutions is centred on understanding the unique needs of each client and their specific data challenges. Our process begins with a thorough analysis of your data and the context in which it will be used. We engage with stakeholders to identify key metrics, desired outcomes, and the audience for the visualizations.
At Think Design, we utilize our proprietary Data Visualization Framework, which guides us in exploring various dimensions of your data—such as distribution, change, interconnection, rank, and proportion. By selecting appropriate visual charting methods for each aspect, we help you uncover insights that drive informed decision-making.
Moreover, we prioritize usability and interactivity in our designs. Our custom solutions are built to enhance user experience, allowing stakeholders to engage with the data dynamically and drill down into specifics as needed. This empowers your team to make data-driven decisions quickly and effectively.
At Think Design, we believe that data visualization can benefit every industry by transforming complex data into actionable insights. However, some sectors where we have seen significant impact include healthcare, finance, retail, and education. In healthcare, data visualization aids in analysing patient outcomes and disease patterns, while in finance, it helps create financial data dashboards for market trends and risk management. Retail and education also leverage data visualization to understand customer behaviour and student performance, respectively. By harnessing these insights, organizations can unlock new opportunities for innovation, accelerate decision-making, and drive transformative change that propels them ahead of the competition.
We utilize a range of innovative tools for data visualization, including Tableau and Power BI. These platforms allow us to create interactive and dynamic dashboards that provide actionable insights. Whether it is crafting Tableau dashboards for complex data analysis or leveraging Power BI solutions for seamless integration with Microsoft ecosystems, our expertise ensures that clients receive tailored visualizations that meet their unique business needs.
Yes, we specialize in designing real-time data visualization solutions and interactive dashboards. By integrating real-time analytics, our dashboards empower businesses to make swift, data-driven decisions. This capability is particularly valuable in fast-paced environments where timely insights can significantly impact operational outcomes. Our team crafts dashboards that are not only visually engaging but also intuitive, ensuring that users can easily navigate and derive meaningful insights from their data in real-time.
